

2020 Arizona Infrastructure Report Card
2020 Report Card GPA: C
Arizona’s infrastructure plays a vital role in the quality of life for Arizonans. Our highways and local streets enable us to get to work and school, while our drinking water pipes help support public health. We must maintain and prepare our infrastructure for the future. Arizona ranked third in population growth in 2019, which stands to strain our systems if we don’t plan ahead. In addition to accounting for population growth, we must consider climate change, wildfires, changes in rainfall, and as we have seen recently, other unusual scenarios like a global pandemic.
Tourism is a major catalyst to Arizona’s economy, creating thousands of jobs. Many visitors travel through our airports and roads to enjoy the beautiful desert landscapes and visit major tourist attractions such as the Grand Canyon. Additionally, our infrastructure is tasked with supporting the delivery of goods and services. Without a healthy infrastructure, our economy and daily lives can crumble. It is important to understand the consequences of neglecting our infrastructure because currently, there is a funding gap.
As stewards of our infrastructure, politicians, civil engineers and the general public need to advocate for sustainable infrastructure capable of supporting our state’s economy, while holding public safety and quality of life at its forefront. Join us in our mission to increase infrastructure investment to repair our existing networks and plan for Arizona’s future.
To read about how each category of infrastructure scored, keep scrolling or read the Report Card for Arizona’s Infrastructure Executive Summary.

-
Explore Arizona
- Grades
- State Fact Sheet
- IIJA Grants
Arizona Infrastructure Grades
A: Exceptional, B: Good, C: Mediocre, D: Poor, F: Failing
Each category was evaluated on the basis of capacity, condition, funding, future need, operation and maintenance, public safety, resilience, and innovation
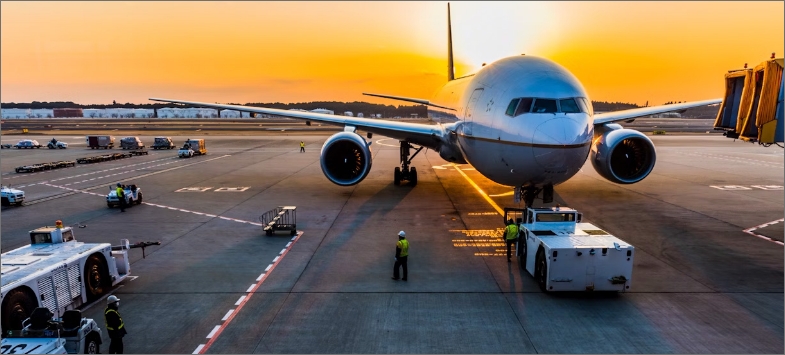

Aviation
Aviation in Arizona is a significant economic catalyst and employs about 17% of all jobs within the state. Major investments have been made to Arizona’s three largest airports, including a $700 million Sky Train extension and a 20-year, $38 billion Comprehensive Asset Management Plan at Phoenix Sky Harbor International Airport (PSHIA). Additional improvements include runway re-pavement and terminal renovation and expansion at Tucson International Airport and a project to improve cargo inspection at Phoenix-Mesa Gateway Airport. Between 2008 to 2018, the percentage of airports having a runway pavement condition index of 70 or better (out of 100) increased from 54% to 64%. These gains in the maintenance of the airport pavements have been made thanks to the Arizona Pavement Preservation Program (APPP) and despite an annual shortfall of approximately $284 million.
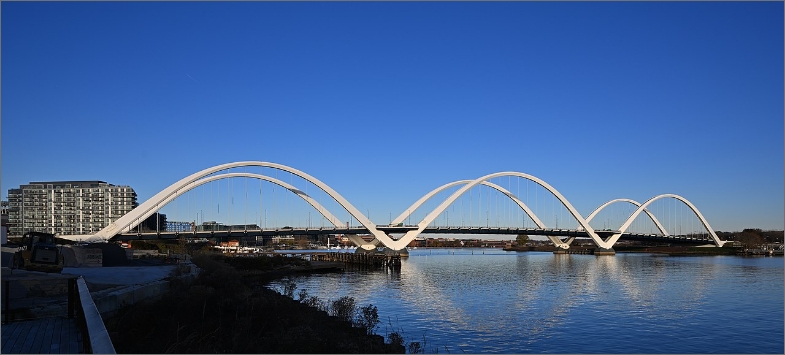
Bridges
Arizona’s 8,320 bridges span almost 6 million square meters and service over 100 million daily crossings. The Arizona Department of Transportation (AZDOT) and other bridge owners have done an exemplary job maintaining their bridges. Just 137 – or 1.6% – bridges were classified as poor in 2019, down from 223 in 2014, and far lower than the national average of 7.5%. Currently, AZDOT has identified 1,789 bridges requiring repairs at an estimated cost of $1.5 billion. The number of bridges needing work is far less than the 2,440 in 2014, but a funding gap remains. Looking ahead, Arizona needs to plan for the future of its surface transportation network as aging bridges, a growing population, and extreme climate conditions put strain on existing bridges and revenue streams.
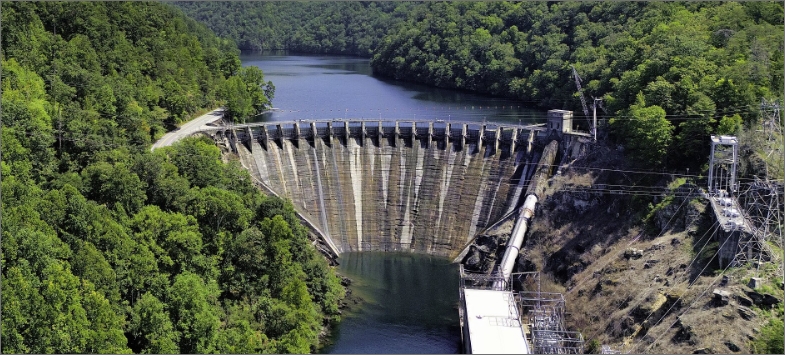
Dams
Of the 384 dams in Arizona, 257 are state regulated dams and 127 federally or otherwise regulated. There are 164 dams in Arizona with a high hazard rating. It is important that high hazard dams are regularly inspected and the condition of these structures is known in order to protect public safety. In Arizona, 95% of dams with a high hazard potential have a condition assessment rating, and more than half of those have a satisfactory rating. Additionally, Emergency Action Plans have been prepared for approximately 95% of the state regulated high hazard dams, which is well above the national average. In Arizona, the responsibility for the safe operation and maintenance of dams lies with the dam owners. Arizona’s dam safety state budget is less than $1 million annually. These funds are only available to conduct inspections and manage the Dam Safety Program for the inventoried and state regulated dams. The Association of State Dam Safety Officials (ASDSO) estimates that rehabilitation of non-federal dams in Arizona will cost $316 million (based on 2012 data).

Drinking Water
Drinking water infrastructure in Arizona moves and stores water for industries and the state’s population. Much of the water mains were built around 30 years ago, and as they age, implementing asset management practices to extend the lifespan of these assets is advised. The price for water across the state of Arizona is relatively low compared to other parts of the country and compared to the price for other less essential consumer goods. The average water bill in 2015 was $43.69, and only increased 6% to $46.09 by 2017. Some utilities decline to raise rates at all, resulting in deferred maintenance. Out of 421 water rate structures with a known effective date, 46% have not updated their rates in the last five years, and 20% have not updated rates in the last 15 years. Appropriate water rates are essential to support the infrastructure we need to treat and distribute safe drinking water.
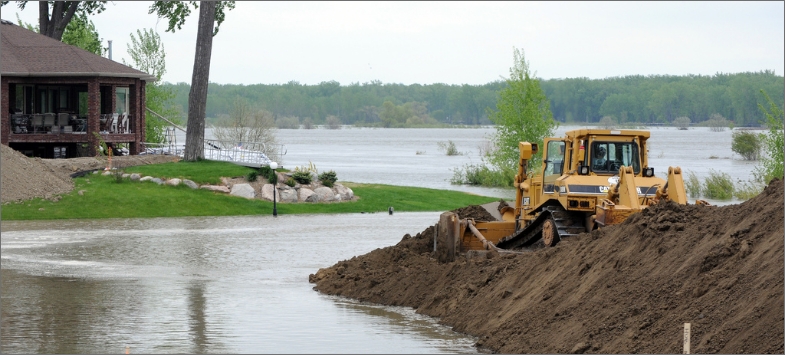
Levees
Levees are critical to Arizona, protecting 345,000 people and close to $60 billion in property. Local flood districts typically perform the necessary operation and maintenance of these structures to ensure public safety of communities. While most levees in Arizona have been inventoried in the National Levee Database, just the 8% of them that are within the jurisdiction of the US Army Corps of Engineers have been screened for condition analysis. The average age of a levee in Arizona is 41 years old. It is likely that only a small percentage of levee owners in the state have adequate funding to address the estimated $10 to $20 million needed per year for repairs, upkeep, and upgrades as the levees continue to age and are burdened by impacts from development and changing runoff-rainfall characteristics.
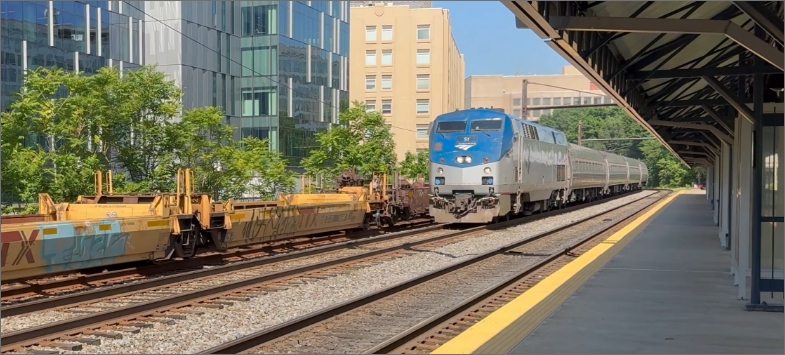
Rail
Arizona rail infrastructure is comprised of two Class I railroads, eight Class III/short line railroads, Amtrak for passenger rail services, and two small tourist railroads. Most rail freight traffic in the state is through-traffic, meaning it continues to other nearby major ports. There has been a decline in passenger rail usage statewide, while freight rail continues to grow beyond the current capacity. Investment in additional passenger rail options, and upgrades to existing freight rail should be the priority moving forward.
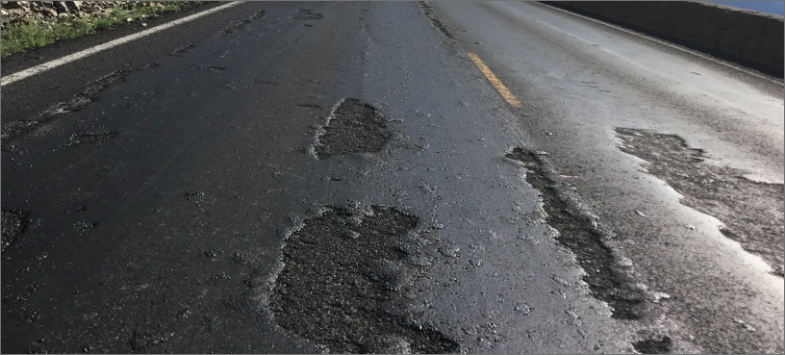
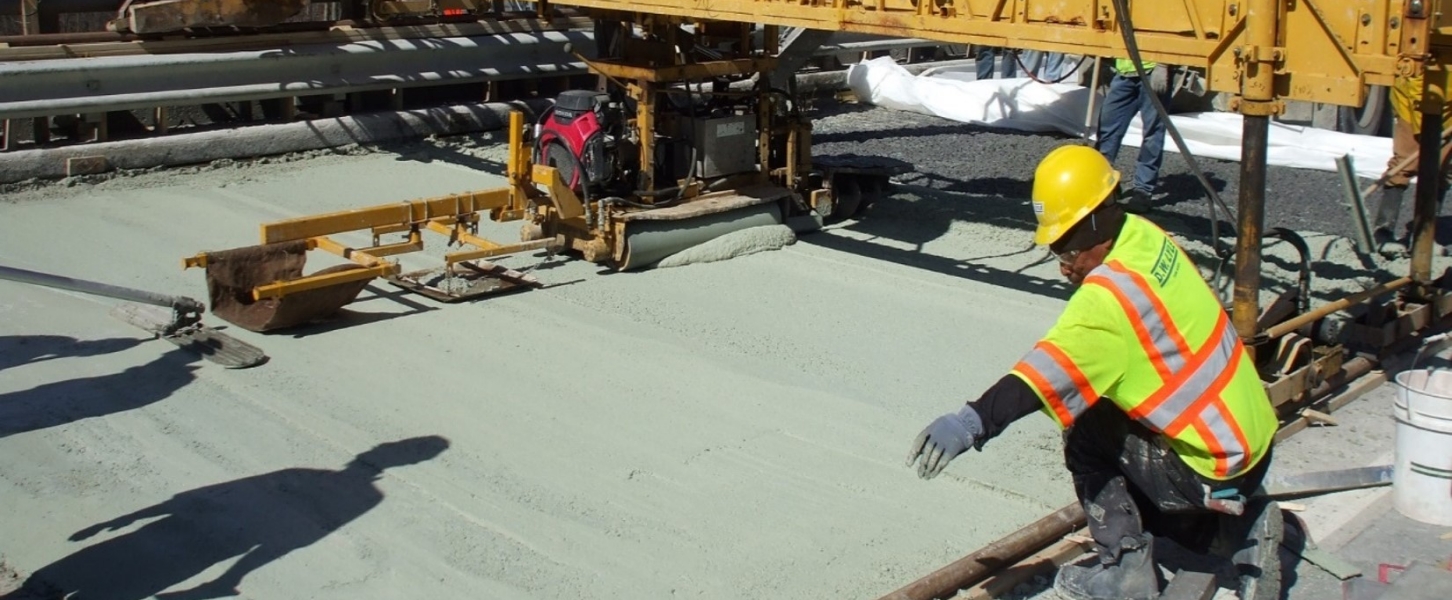
Roads
Arizona’s road infrastructure is critical to the state’s economic success. Arizona’s population, 6.6 million people, is using more than 66,000 miles of public roads, each traveling an average of 36.4 miles per day. Residents and visitors exert a significant demand on the state’s roadways, so the local, state, and federal funding cannot adequately keep up with the expansion, modernization, and preservation required for safe and well-maintained roadway infrastructure. More money could be allocated to infrastructure by raising the gas tax and voting in favor of transportation initiatives. For Arizonans, the repair costs attributed to poorly maintained roads and bridges is reported to be more than three times what the cost of an increased gas tax would be.
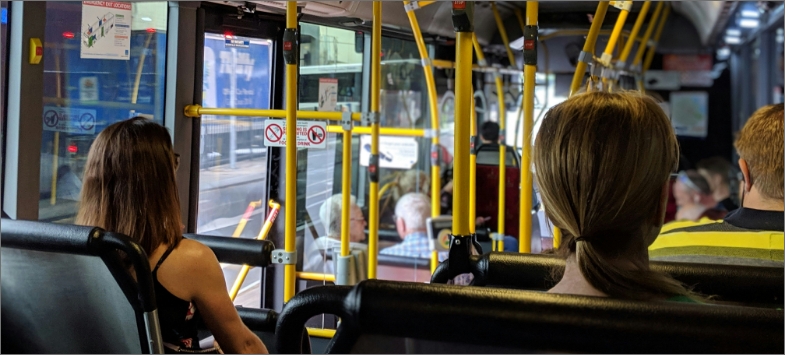
Transit
For every dollar invested in public transportation, approximately four dollars in economic returns are generated. An investment in transit is an investment in our community. Arizona has begun its commitment to public transportation, including pursuing and acquiring several grants, however more can and should be done to ensure all Arizonans have efficient and reliable access to transit. Arizona legislators can accomplish this by raising the gas tax (which has not been raised in nearly 30 years). Furthermore, Arizona should continue to foster and encourage innovative solutions to reaching transit and assisting users in completing their last mile. One option to improve this is to allow more electric scooters throughout the state with adequate regulations. Importantly, transit is only as effective as its accessibility. While Arizona can be proud of the progress made to make public transportation a viable option, more can be done to expand services and improve first-mile/last-mile connections to public transportation.
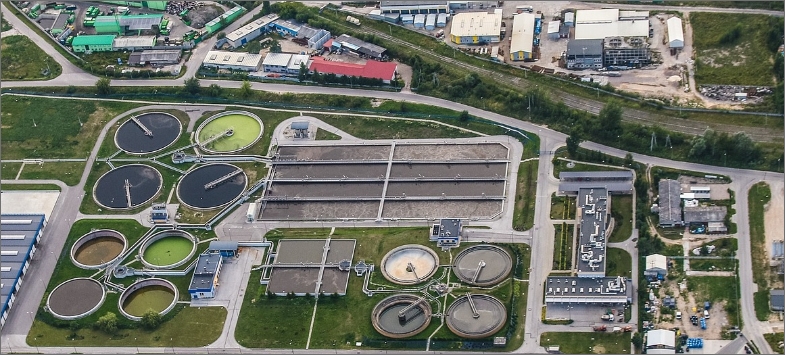
Wastewater
Wastewater infrastructure serves our basic sanitation needs and has a measurable value for public health, quality of natural environments, and the ability to support population and economic growth. However, for Arizona’s wastewater sector to maintain the state’s economic and projected population growth, 25 to 50% of the state’s collection network and 10% of the wastewater treatment plants (WWTPs) require rehabilitation, plus expansion of more than a dozen WWTPs. Additionally, disparities in technical, financial, and management capacity exist between urban and rural utilities. An aging workforce is another challenge; up to 15% of staff has or is retiring and will require replacement in the coming years. Overall, Arizona’s wastewater infrastructure experiences a $1.4 billion investment shortfall. Though a significant funding gap for our wastewater infrastructure exists, there has been a positive trend in recent investments, but those trends are not uniform across the State.
Less than 2% of bridges in Arizona are in poor condition, far lower than the national average.
State Fact Sheet
Download Fact Sheet
8,587
Bridges
1%
of Bridges are Deficient

162
High Hazard Dams

$28.4B
in Drinking Water Needs

368 Miles
of Levees
Protecting 464,000 people

54%
of Roads in poor or fair condition

$ 871
Motorist pays annually
due to insufficient infrastructure
66.6M
Passenger Trips on Public Transit
$20.1B
Wastewater needs

$10.4B
Total storm damage
(1980-2024)
IIJA Grants
IIJA Funding Announced
Number of IIJA Projects
I-10 Expansion Project: This $95 million award will widen approximately 10 miles of I-10 in the Gila River Indian Community and Pinal County from two lanes to three, improve interchanges, and replace low-clearance bridges, resulting in enhanced safety, reduced congestion, and improved freight mobility.
Gila River Indian Community Water Projects: This $118 million award will build a reclaimed water pipeline and crop irrigation system to conserve 200,000 acre-feet of water, resulting in improved drought resilience and sustainable water management in the Colorado River Basin.
San Luis I Land Port of Entry Modernization: This $200 million award will modernize and expand the San Luis I Land Port of Entry, doubling vehicle inspection lanes and boosting pedestrian inspection capacity by 40%, resulting in faster border crossings and new job opportunities for local communities.
Connect with Your Legislators
Let everyone know how important it is that we continue to invest in the future of America’s infrastructure.
Take Action Today