
2025 Colorado Infrastructure Report Card
2025 Report Card GPA: C-
Colorado’s infrastructure is at a critical crossroads. As the state’s population continues to grow and climate-related challenges intensify, the systems that support daily life, from clean water and safe roads to reliable energy and resilient parks, are under increasing strain. In 2025, the Colorado Section of the American Society of Civil Engineers (ASCE) conducted its comprehensive assessment of the state’s infrastructure across 14 categories. The result: Colorado’s overall infrastructure grade remains a C-, unchanged from 2020, signaling persistent challenges and urgent needs despite areas of progress.
This grade reflects a system that is largely functioning but shows signs of distress. Many of Colorado’s assets are aging, underfunded, and increasingly vulnerable to extreme weather, population pressures, and evolving regulatory demands. Some sectors have made commendable strides, such as dams and wastewater, which saw improved grades due to targeted investments and modernization efforts; however, others, including energy, roads, and aviation, continue to lag due to outdated systems and insufficient investment.
Key findings from the 2025 report include:
- Aging Infrastructure: From schools averaging 41 years old to wastewater and drinking water systems exceeding their design life, aging assets are a recurring theme. Deferred maintenance and limited funding are compounding long-term risks.
- Infrastructure Resilience: Wildfires, floods, and droughts are testing the limits of Colorado’s infrastructure. Levees, stormwater systems, and energy grids are particularly vulnerable, underscoring the need for climate-adaptive planning and investment.
- Funding Gaps: Despite new legislation and federal support, many sectors, especially roads, transit, and water systems, face significant funding shortfalls. For example, Colorado’s roads cost drivers $1,705 annually in wear and tear, more than double the national average.
- Innovation and Progress: Bright spots include the expansion of renewable energy (now 41% of electricity generation), bridge construction innovations, and the economic impact of aviation, which now contributes over $71 billion annually. Transit agencies are also embracing new models and technologies to improve access and efficiency.
- Equity and Access: Rural and underserved communities face disproportionate challenges, particularly in education, water quality, and transit access. New policies, such as House Bill 24-1448 —which overhauls the state’s outdated school funding formula to better support at-risk and rural students—aim to address these disparities, but implementation will take time.
Colorado’s engineers, planners, and policymakers are working hard to stretch limited resources and adapt to changing conditions. However, maintaining the status quo is not enough. Without bold, sustained investment and strategic planning, the state risks falling behind in its ability to support economic growth, protect public health, and ensure a high quality of life for all Coloradans.
The 2025 Report Card is a call to action. It highlights the need for:
- Stable and increased funding mechanisms
- Resilient and adaptive infrastructure planning
- Workforce development and innovation
- Stronger data collection and asset management
Colorado stands at the headwaters of the nation both literally and figuratively. The choices made today will shape the state’s infrastructure legacy for decades to come.
-
Explore Colorado
- Grades
- State Fact Sheet
- IIJA Grants
Colorado Infrastructure Grades
A: Exceptional, B: Good, C: Mediocre, D: Poor, F: Failing
Each category was evaluated on the basis of capacity, condition, funding, future need, operation and maintenance, public safety, resilience, and innovation
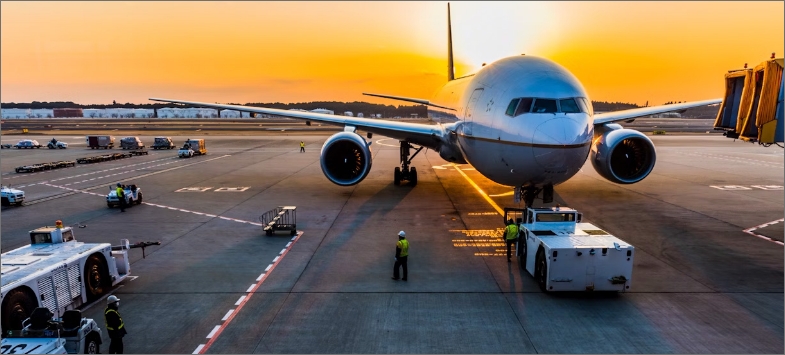

Aviation
Colorado has 66 public-use airports, consisting of 13 commercial service airports and 53 general aviation airports, which are essential to the state’s economy and infrastructure. These airports generate $71.2 billion in annual business revenue, support 358,293 jobs, and contribute $25.5 billion in payroll. Denver International Airport (DEN) alone accounts for $45.3 billion in revenue and over 240,000 jobs. Although federal funding through the Infrastructure Investment and Jobs Act (IIJA) has supported many Capital Improvement Programs, increasing demand is straining airport capacity. For instance, DEN was designed for 40 to 50 million passengers but served 82 million in 2024. This surge, despite post-pandemic growth, has contributed to a grade drop from 2021 to 2025. Continued investment is critical to maintain economic resilience, ensure public access, and improve intermodal connectivity as Colorado’s population and travel needs expand.
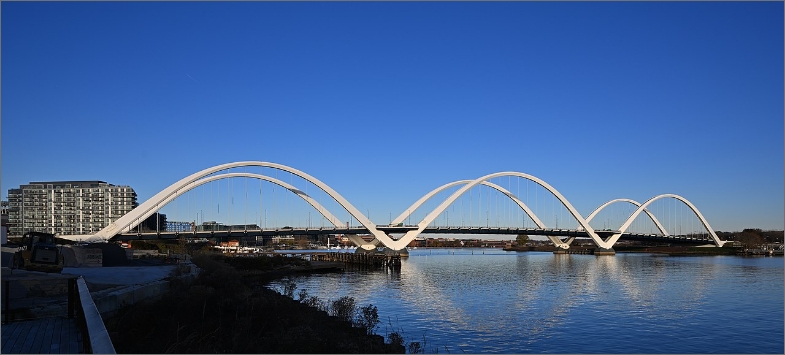
Bridges
Colorado’s 8,965 bridges play a vital role in transporting people and goods and spurring economic activities. Currently, 4.8% of these bridges are in poor condition, which means they need substantial maintenance and rehabilitation, and in some cases, replacement. In total, the state has identified 1,254 bridges that are in need of repair, with an estimated cost of $1.1 billion. Recent legislative measures, such as the Statewide Bridge and Tunnel Enterprise, which will increase funding through new bridge and tunnel impact fees, are anticipated to generate over $500 million over the next decade. Bridges are essential to Colorado’s transportation network, supporting over 88 million daily crossings that facilitate both commuting and economic activity across the state. To ensure the safety, reliability, and longevity of Colorado’s bridge infrastructure, investments in innovative design, construction methods, and resilience measures are necessary to meet the demands of the state’s growing population and economic activities.
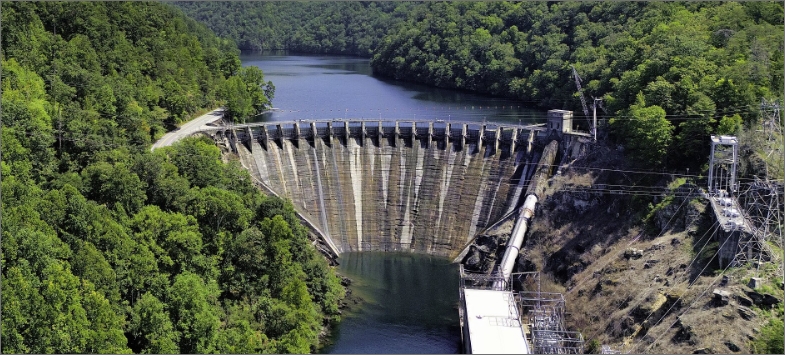
Dams
Colorado is in an arid environment and at the headwater of the Colorado river that provides water for much of the western United States. Colorado has 1,938 dams, and they have grown increasingly important due to the state’s rising population, their role in supporting downstream water needs in other states, and their contribution to in-state irrigation. Colorado has a total of 42 high-hazard dams, with some of the state’s largest infrastructure projects currently undergoing construction of new dams. An estimated $20 billion in investments are needed in the state for water supply, infrastructure, and storage capacity. While the reservoir storage capacity for the state continues to increase, increased permitting requirements, growing construction costs, increased maintenance needs, and other restrictions pose challenges to maintaining and building these important assets.

Drinking Water
Colorado’s drinking water infrastructure faces mounting challenges from aging systems, population growth, and climate-related stress. As a headwaters state, Colorado supplies water to 19 states and Mexico, yet retains only 40% of its water. Competing demands from irrigation and municipal use, especially east of the Continental Divide, strain resources. The Colorado Water Plan projects a supply gap by 2050 equivalent to 250,000 households. Over 2,000 public water systems—many over 50 years old—require significant upgrades, with the EPA estimating over $10 billion needed in the next decade. Additional funding of $1.5 billion is required to meet future capacity. Workforce shortages and reliance on ratepayer funding further complicate progress. While the state has responded to threats like per- and polyfluoroalkyl substances (PFAS), lead service lines, and natural contaminants, small and rural communities remain vulnerable. Ensuring a sustainable drinking water future will require stable funding, skilled workforce, and resilient infrastructure planning.
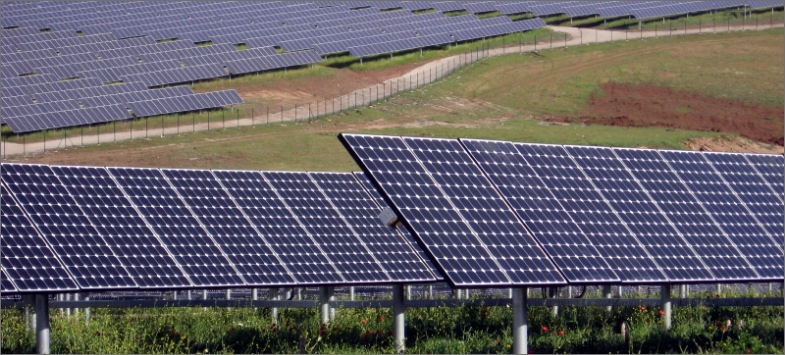
Energy
Colorado’s energy infrastructure faces mounting pressures due to aging assets, climate-driven disruptions, and a rapidly transforming energy mix. While renewables now contribute 41% of the state’s electricity, outdated coal plants and insufficient energy storage capacity threaten reliability. Severe weather events—such as the Marshall Fire, linked to electrical infrastructure failures, and major storms that impacted over 150,000 residents—underscore the urgent need for resilience investments like microgrids, advanced smart grid technologies, and pipeline modernization. Utilities are proactively investing billions of dollars into transmission upgrades, wildfire mitigation, and renewable integration, yet significant additional resources and strategic planning are essential to safeguard Colorado’s energy future.
Levees
Colorado’s levee systems continue to lack consistent standards or regulations for evaluating or inspecting performance. As extreme weather events become more frequent, the importance of levees in protecting communities continues to grow. Nationally, efforts are underway to improve levee safety, including a one-time nationwide inspection, consolidation of data in the National Levee Database (NLD), and the development of model state programs and national guidelines. Colorado’s levees, located in FEMA Region 8, are maintained by a range of public and private entities. However, over 70% of permitted levees were built before 1988, prior to the adoption of state design standards. At least 15 levee systems in the state have unknown ownership, and many unpermitted levees exist, especially in rural areas. A comprehensive statewide inventory is needed to assess risks and guide future investment in levee infrastructure.
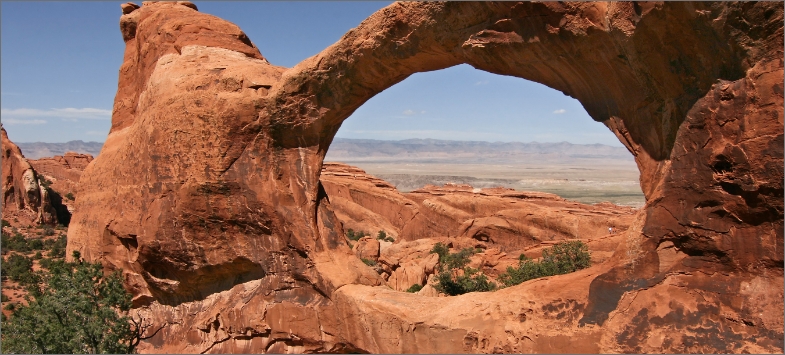
Public Parks
Colorado proudly maintains 13 national parks and monuments, 11 national forests, two national grasslands, 43 state parks, and numerous open areas, recreation areas, city parks, and trails across the state. Parks are crucial to Colorado’s economy, contributing approximately $65.8 billion annually to the state and supporting over 400,000 jobs. Despite their importance, many park agencies lack the financial resources to adequately maintain trails, restrooms, and more, especially as usage rates rise. The National Park Service (NPS) identified $558 million in deferred maintenance in the 13 parks and monuments managed in Colorado. In 2023, National Parks in Colorado had approximately 7.8 million visitors, a slight decrease since 2021, largely due to new timed entry systems and shuttles to accommodate the increasing number of visitors to Colorado parks. Meanwhile, park managers throughout the state are finding ways to adapt to extreme weather and make their parks more resilient.
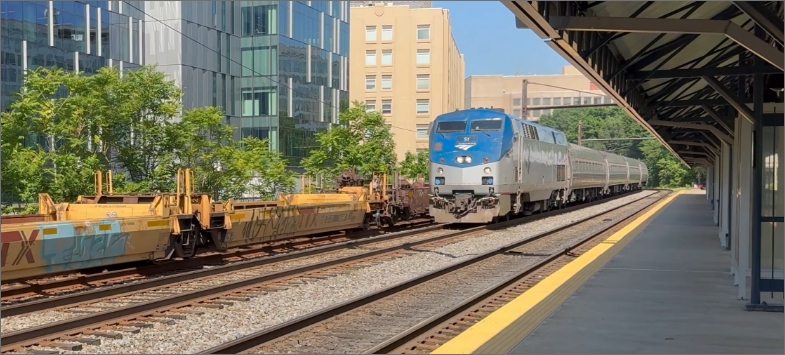
Rail
Colorado’s rail system moves 400,000 tons of goods daily, including coal, crude oil, lumber, cement, and grain, while Amtrak provides over 228,000 annual boardings. Class I freight railroads handle most freight, with Class II and III lines connecting rural towns and key agricultural and resource-producing areas. Two year-round passenger rail services link Colorado communities and neighboring states. While the system meets acceptable standards overall, challenges persist. Short line railroads often lack funding to maintain the infrastructure needed for Class I connectivity, and passenger rail requires investment to expand service to underserved regions. Nearly all rail infrastructure is privately owned and funded, limiting public investment opportunities. As Colorado’s population grows, strategic investment across both freight and passenger rail is essential to improve safety, efficiency, and
connectivity. A well-financed, modern rail network will support economic growth and ensure long-term mobility for residents and industries across the state.
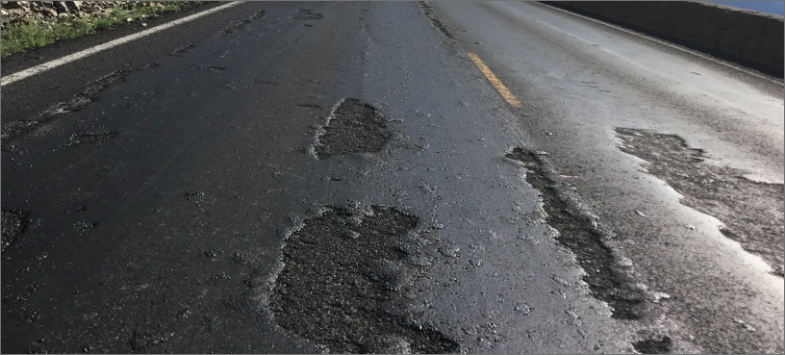
Roads
Colorado’s roads continue to face challenges due to mountainous terrain and poor funding. In Colorado, only 34% of roads are in good condition compared to 45% nationally. Additionally, the natural beauty and economic growth that draws new residents to the state has also led to roadway congestion. Colorado has some of the costliest maintenance challenges in the country as well inhibiting the necessary upkeep of roads. Lower investment levels across operation, maintenance, capacity, and innovation are borne by drivers. Colorado’s cost per motorist due to deteriorated and congested roads is almost $1,900, about 35% higher than the national average. Additionally, even with the 6-cent increase in the state gas tax, effective July 2025, Colorado’s transportation infrastructure remains underfunded, particularly as more trips are made by hybrid and electric vehicles.
Schools
Schools in Colorado are aging, with an average age of 41 years, requiring significant repairs and retrofits. The estimated cost to address these deficiencies is over $13.5 billion, projected to rise to $17.5 billion by 2030. Declining birth rates and school enrollments have led
to closures in some districts, while new schools are needed in others. Funding remains a significant challenge, with Colorado ranking 33rd in per-pupil spending. House Bill 24-1448, which will take effect in the 2025- 2026 school year, and be gradually implemented over 6 years, aims to increase funding for K-12 education, focusing on at-risk students and rural districts. Further, community involvement in funding decisions and increased state support is vital for improving school conditions and operations.
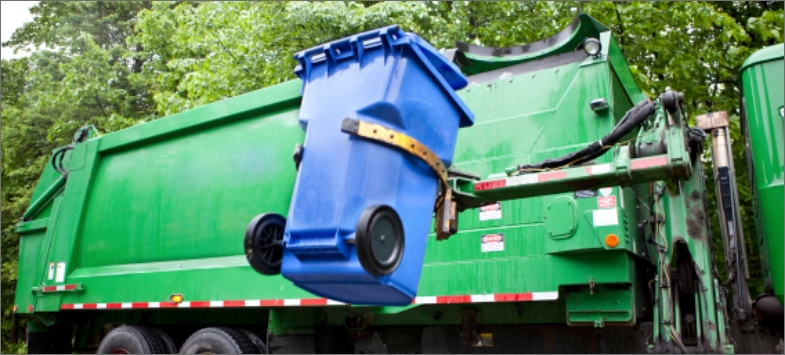
Solid Waste
Solid waste refers to any discarded material, ranging from compostable items and industrial byproducts to everyday household trash. Colorado generates about 6.87 million tons of municipal solid waste (MSW) annually, which has decreased by 30,000 tons in the last four years. This waste is then transported to one of the 76 landfills in the state. Despite increased funding, the state continues to struggle with a declining share of waste being recycled or
composted (known as diversion rates), limited reporting on closed landfills, and the resulting environmental impacts. Additional attention is needed to improve overall solid waste management, including through the promotion of recycling innovations, targeted initiatives, and supportive programs. If Coloradans begin to see their waste as a resource—such as nutrients or fuel—it can be transformed into something useful, benefitting the state both environmentally and economically.
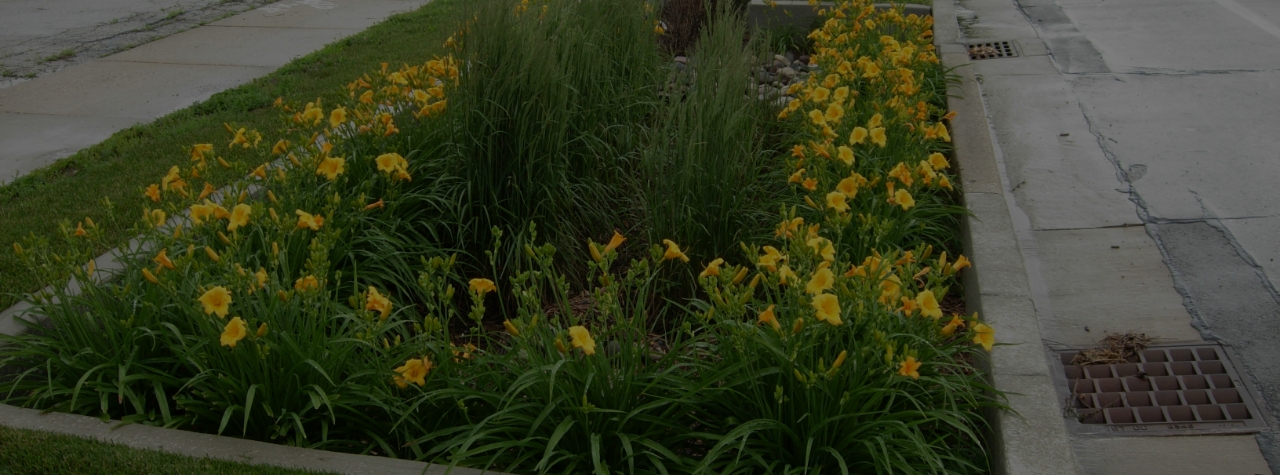
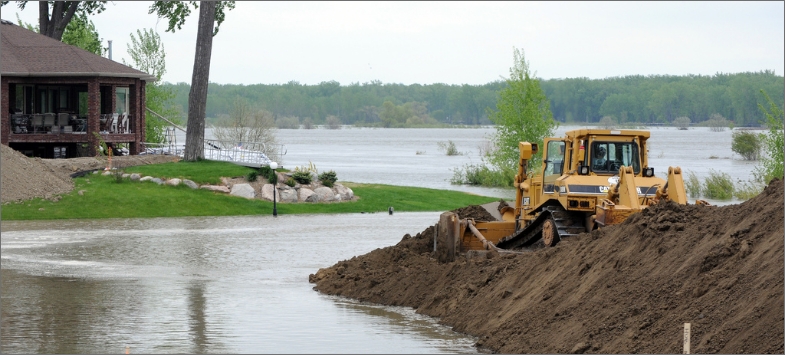
Stormwater
Colorado’s stormwater infrastructure consisting of pipes, channels, and green infrastructure is essential for public safety, environmental protection, and economic resilience. However, the network is increasingly strained by urban growth, aging systems, limited funding, and climate-related threats. The 2013 floods, which caused over $2 billion in damage, exposed critical vulnerabilities in system capacity and resilience. Urbanization compounds the issue, with Denver reporting over 51% impervious land cover in 2025, projected to rise by 5% per decade. This expansion increases runoff and flood risks, especially in older areas with undersized or deteriorating infrastructure. Many systems lack the capacity to manage high-volume precipitation events, as seen in both localized flooding and statewide emergencies. Strategic investment is needed to modernize and expand stormwater infrastructure across Colorado.

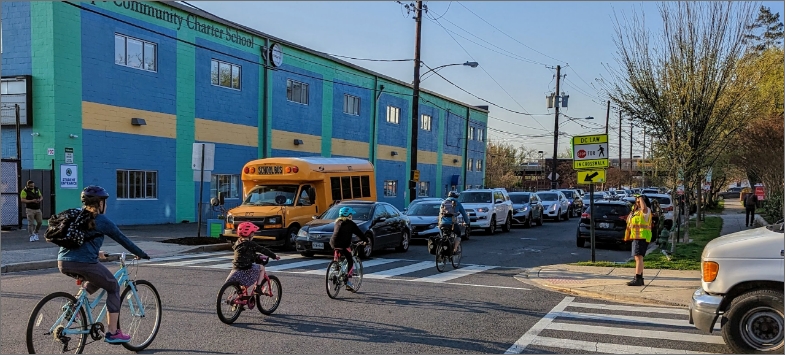
Transit
Colorado’s transit agencies continue innovating in response to challenges in urban, rural, and resort transit systems. The state is served by approximately 60 transit agencies providing diverse transit options such as bus, light rail, commuter rail, demand-response services, and vanpools. Agencies throughout the state use both state and local policies, alternative transit operations models, technology, and regional collaboration to meet evolving needs. There has been an increased focus on transit and active transportation at state and local levels, helping to address funding gaps and improve first/last mile connectivity – key barriers that can make using transit difficult in some areas. However, the state’s transit system has not yet fully recovered from the effects of the COVID-19 pandemic, when the state experienced nearly a 50% drop in unlinked passenger trips. Continuing efforts by state and local policymakers, along with strong support from Colorado’s voters, are expected to keep the state on track to surpass pre-pandemic service levels and increase conditions and access for Coloradans.
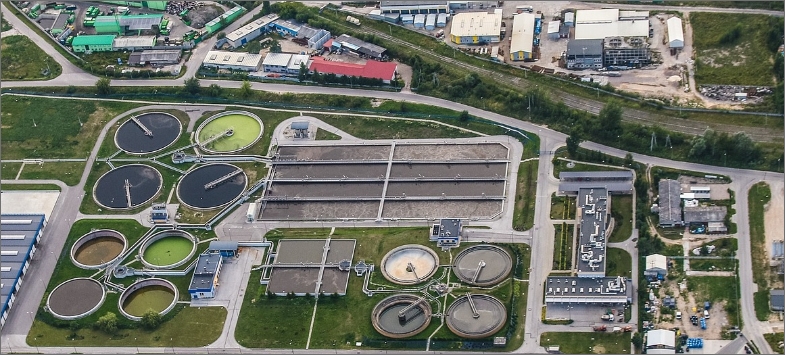
Wastewater
Colorado’s wastewater infrastructure is challenged by aging systems, limited capacity, evolving regulations, and workforce shortages. Many facilities operate with infrastructure at or beyond its intended lifespan, requiring frequent maintenance and costly upgrades. Population growth adds further strain. The state estimates $6.2 billion in need for systems serving over 10,000 people. While funding comes from state, federal, and local sources, rate-based revenues often fall short, delaying critical projects and requiring rate increases. Emerging contaminants like per- and polyfluoroalkyl substances (PFAS) and the push for advanced technologies, including wastewater reuse, highlight the need for strategic investment. The Colorado Wastewater Utility Council (CWWUC), in collaboration with ASCE, identified aging infrastructure and slow permitting as major barriers to timely upgrades and funding access. To protect public health, meet regulatory standards, and build climate resilience, Colorado must prioritize infrastructure investment, streamline permitting, and support workforce development and innovation to ensure long-term system sustainability

Only 34% of Colorado roads are in good condition, compared to 45% nationally
State Fact Sheet
Download Fact Sheet
8,990
Bridges
5%
of Bridges are Deficient

472
High Hazard Dams

$32.9B
in Drinking Water Needs

72 Miles
of Levees
Protecting 46,000 people

48%
of Roads in poor or fair condition

$ 831
Motorist pays annually
due to insufficient infrastructure
92.0M
Passenger Trips on Public Transit
$44.8B
Wastewater needs

$50.5B
Total storm damage
(1980-2024)

IIJA Grants
IIJA Funding Announced
Number of IIJA Projects
Arkansas Valley Conduit: This $250 million award will construct a 230-mile water pipeline from Pueblo to deliver clean drinking water to 50,000 people across Southeastern Colorado, resulting in improved water access and reliability for communities long awaiting this project.
I-70 Floyd Hill Safety Improvements: This $100 million award will improve the I-70 Mountain Corridor by reducing collisions between vehicles and wildlife, easing traffic congestion, and preventing rockslides, resulting in safer travel and enhanced reliability for drivers.
Leadville Mine Water Treatment Plant Replacement: This $56 million award will replace the Leadville Mine Drainage Tunnel and Treatment Plant to remove heavy metals from contaminated water, resulting in clean water access and improved public health for the community.
Connect with Your Legislators
Let everyone know how important it is that we continue to invest in the future of America’s infrastructure.
Take Action Today