

2019 Kentucky Infrastructure Report Card
2019 Report Card GPA: C-
Kentucky’s infrastructure is everywhere around you and you use it every day. The interconnected system of roads and bridges, drinking water, sewer systems, dams and levees, aviation, solid waste, and energy are all critical to our success. We have become accustomed to these systems quietly supporting our ability to work and play. However, in 2019, our infrastructure networks are aging and struggling to perform as necessary.
Infrastructure deteriorates as it ages, and it must be repaired or replaced when it exceeds its useful life. The effects of time, weather, and increased use from a growing population are impacting the quality of the infrastructure in our state. Looking ahead, there are opportunities for Kentucky to invest not only in the infrastructure in need of repair and replacement but also to plan strategically for the future. Through smart investment and collaborative coordination, Kentucky has the opportunity to meaningfully improve critical infrastructure networks, including water, wastewater, roads, rail, airports, and freight, to ensure both local and state-wide economies can grow. Strategic investments and proper planning will also provide safe and healthy environments for our children, neighbors, and communities.
The good news is that Kentucky’s civil engineers, government agencies, private interest groups, and the public are committed to building and maintaining Kentucky’s infrastructure to keep our residents and visitors safe, the environment healthy, and to help support our economy. The Kentucky Section of the American Society of Civil Engineers has created this simple tool to give residence, businesses, and policy-makers a snapshot at the current condition of our state’s infrastructure systems—both the good and the not-so-good. In addition, this report provides recommendations on things our Commonwealth can do to make sure our infrastructure is there for us in the days, weeks, and years ahead. Working together, we can implement a pro-active and collaborative approach to infrastructure planning and funding that promotes smart investments to avoid costly, catastrophic failures.
We hope this report provides the information needed to make every Kentucky citizen an informed Kentucky citizen.

-
Explore Kentucky
- Grades
- State Fact Sheet
- IIJA Grants
Kentucky Infrastructure Grades
A: Exceptional, B: Good, C: Mediocre, D: Poor, F: Failing
Each category was evaluated on the basis of capacity, condition, funding, future need, operation and maintenance, public safety, resilience, and innovation


Aviation
Kentucky airports have a total economic impact of nearly $15 billion annually. When airports are kept in working order, aviation has a positive impact on a broad array of services for our Commonwealth, including military, healthcare, and transportation of goods and services, just to name a few. There are funding sources in place to support infrastructure facilities within the state; however, significant needs exist, including a consolidated rental car facility at CVG, the final portion of a five-phase taxiway project at LEX, and continued modernization of airfield elements at SDF. While the state has made recent airfield improvements and needed terminal upgrades at several of its primary facilities, we are confronted with aging facilities and cannot fully realize new economic opportunities without needed infrastructure improvements.
Bridges
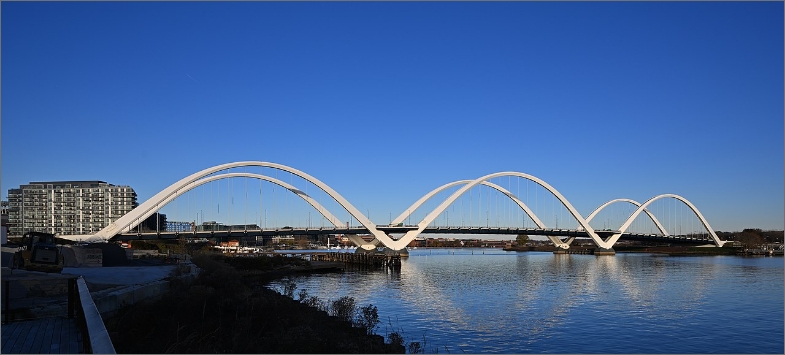
The overall condition of Kentucky’s bridges has steadily improved in recent years, in part thanks to the prioritization of investments in transportation infrastructure by the Transportation Cabinet, through the Strategic Highway Investment Formula For Tomorrow evaluation and scoring system. In 2011, nearly 9.25 percent of all bridges in Kentucky were structurally deficient; by 2017, 7.77 percent were structurally deficient, a reduction of 180 bridges. However, looking ahead, 2,857 bridges have been identified as needing repair, which the state estimates will cost $1.8 billion. This does not include the needed repairs and additional capacity needed on the I-75 bridge between Kentucky and Ohio, nor does it include a new I-69 bridge over the Ohio River between Kentucky and Indiana.
Dams
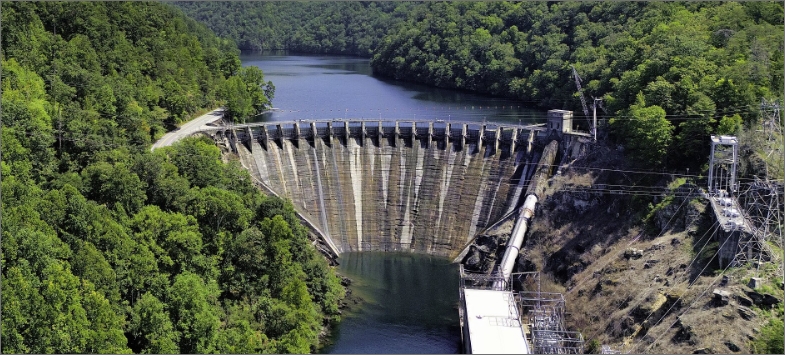
Dams are a critical part of Kentucky’s infrastructure, and many citizens of the Commonwealth enjoy the valuable benefits they provide. In recent years, the state has seen an increase in the number of high-hazard dams, meaning those that have the potential for loss of life and significant property destruction if they should fail. This is due to areas downstream of these dams being developed, creating populations at risk that did not previously exist. In addition, a majority of the Commonwealth’s dam structures are now more than 50 years old. Fortunately, whereas in 2010 less than 5 percent of high-hazard dams had Emergency Action Plans (EAPs), approximately 75 percent have at least simplified draft plans today. However, necessary state funding to implement other safety programs, assistance for private dam owners, and direct funding for state-owned and operated dams for rehabilitation of aging dams has been dramatically cut. Funding is needed to rehabilitate high-hazard dams, support public and private dam owners in maintenance needs, improve emergency preparedness, increase education of dam safety for both owners and the public, update inspection methods and equipment, and hire additional staff for regulatory condition inspections.

Drinking Water
Kentucky enacted legislation in 2000 to promote regional cooperation and water system consolidation throughout the Commonwealth. After 18 years, Kentucky has made significant progress in extending public water service to more than 97 percent of the state’s population. Kentucky has deployed a robust, online Water Resource Information System and has continued to consolidate and regionalize the number of public water systems in order to serve more citizens and gain efficiencies. Kentucky has also established a Drinking Water Advisory Council, to provide input on drinking water regulations and best practices in water management, treatment, and distribution. While Kentucky has made significant progress in consolidation of water systems and service levels, several challenges have been identified, including compliance with the Safe Drinking Water Act (SDWA) Disinfection Byproducts Rule (DBPR) in some small systems; reduced state funding to the 2020 Water Program; water loss that averages 30 percent on a state-wide basis; and drinking water infrastructure needs that have increased 33 percent from 2013 to 2017, with a current estimate of $8.2 billion over 20 years.
Energy
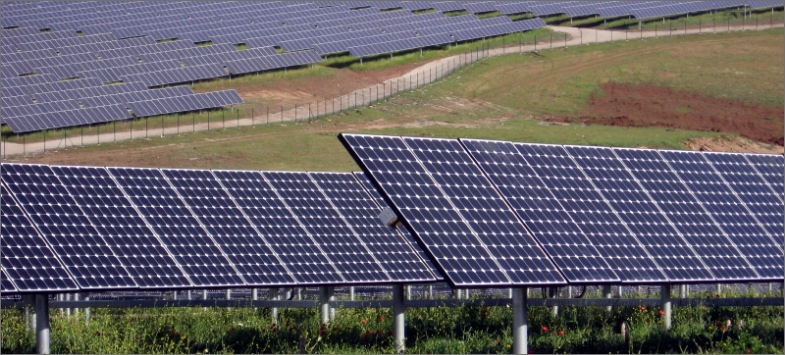
The Commonwealth of Kentucky, with two major coal fields located within the state, has historically enjoyed the benefits of low cost electricity. The close proximity of the coal fields has kept transportation costs low, which has benefitted the state’s economic development efforts. The average price of electricity as reported by the Kentucky Office of Energy Policy is 8.26 cents per kWh, which is the sixth lowest in the United States. Low energy costs have helped Kentucky attract manufacturing and other key industrial and commercial enterprises, which is an important part of the state’s economy. Similar to industries across the country, in the past decade Kentucky industries have reduced output, with some companies closing or leaving the state. Total energy demand in Kentucky has still not rebounded to pre-recession levels—electricity generation dropped by one-fifth, from 2014 to 2017 alone. This reduction in electrical load has alleviated previous transmission capacity issues; however, the sharp decrease in demand for energy also presents a challenge with a subsequent decrease in funding for the infrastructure system needed to deliver energy across the state. To continue to meet the Commonwealth’s energy demands and maintain low energy costs, Kentucky must continue to develop and maintain a diverse energy portfolio that includes coal, natural gas, and additional sustainable resources. Kentucky must also answer the challenge of how to fund improvements to the transmission and distribution infrastructure.

Hazardous Waste
In Kentucky, hazardous waste is tracked from the point of generation until it is properly disposed or treated. With more than 3,000 entities generating hazardous waste in Kentucky, proper management is essential to protecting human health and the environment. There are 30 treatment, storage, and disposal facilities in the state that can accept hazardous waste, and this number appears to be sufficient for the state’s needs, as there have been no new recent requests for a permitted management facility. Aside from newly generated hazardous waste needs, there are 62 environmentally damaged sites still undergoing corrective action today, and the state has 20 Superfund sites on the National Priorities List, which is on par with the national average of roughly 26 per state. In addition, there are hundreds of old or abandoned waste sites that still pose threats to the environment and public health. However, funding is not available to address cleanup of all of these sites. Kentucky has projected $1.6 billion in remedial costs, but with an annual budget of $450,000. It is clear that the Commonwealth is at risk of not being able to meet its statutory obligations to protect human health and the environment.
Levees
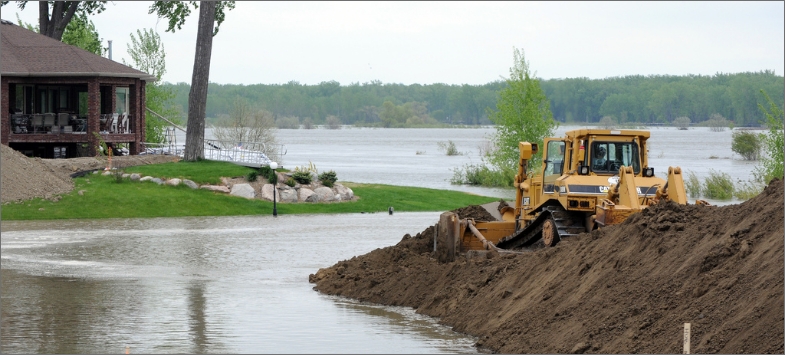
Levee systems are an important part of Kentucky’s landscape, because the rivers and waterways that provide needed transportation and water supply also have a history of devastating floods. The Commonwealth learned the importance of building flood protection after the historic flood of 1937. Since that time, Kentucky has built a network of levees across the state, now protecting more than 306,000 lives and $46.6 billion in property. However, nearly half of the state’s inventory of levees are 50 years old or more, which is beyond their expected design life. Many mechanical and electrical components of these systems were built in the 1940s and 1950s, and as such, many levee systems are deteriorating, and an increase in overall maintenance is required. In addition, two levee systems are classified as a level two or “High Risk,” which means that inundation due to breach and/or system failure would very likely result in loss of life, large economic losses, and/or devastating environmental consequences. Sustained actions are needed in order to mitigate these risks. Remediation of these systems will need funding, and the cost of inaction is a large threat to public safety.
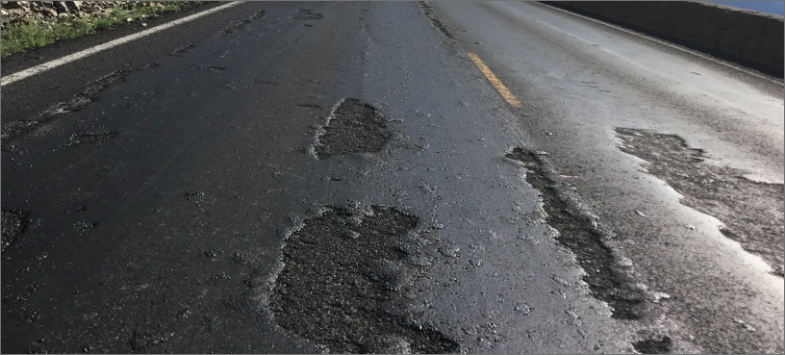
Roads
Kentuckians depend on having an efficient, safe, and well-maintained transportation network to provide easy access to work, school, medical offices, grocery stores, sporting events, and other locations. The state has recently acted to improve the roadway network by enacting a Highway Plan that will provide $8.5 billion for over 1,400 projects across the state over the next six years. The condition of the road systems is improving; the Kentucky Transportation Cabinet’s (KYTC) performance score for all roads in 2018 was 84.5, which is well above the goal of 80 and is the highest score given to date. While this is encouraging, there continues to be inadequate funding for needed construction and safety initiatives. The KYTC recently identified $6 billion in unfunded construction projects, which would require an additional $490 million per year to address. In addition to current needs for road maintenance and safety initiatives, the state must also plan for future growth, as traffic volume has increased by 5 percent since 2013.
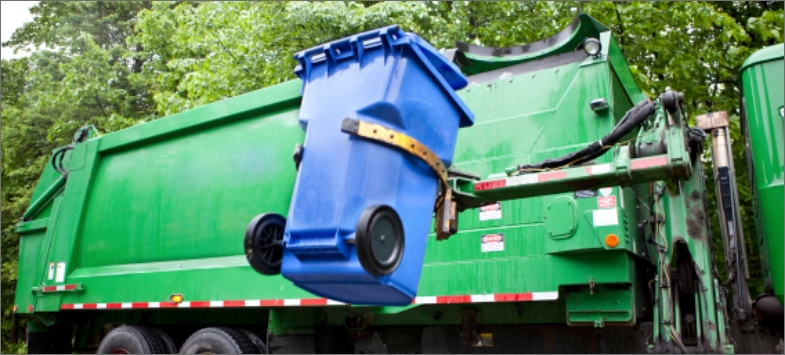
Solid Waste
In 2017, Kentucky residents generated 7.2 million tons of municipal solid waste (MSW), which is an average of 5.5 pounds of waste per person, per day. This is above the national average by about 25 percent. Of the waste generated, about 38 percent is recycled; Kentuckians are doing better than the national average in this area. For the remaining waste that is not recycled, Kentucky has 50 permitted solid waste facilities, which processed 4.7 million tons of waste in 2017. Since the time of the last Kentucky Infrastructure Report Card in 2011, the Commonwealth has increased its number of solid waste facilities. In 2011, there were 29, which included contained and construction demolition debris landfills together as one facility, and there were no residual landfills, which accept waste from specific industrial categories. In 2018, Kentucky had 50 solid waste facilities, including 29 contained landfills, eight sites that are greater than one acre for construction/demolition debris, and 13 residual facilities. This has increased the available capacity in the Commonwealth’s landfills. However, as the total population has increased, so has Kentucky’s waste generation, and more work is needed to maintain or improve capacity to meet future needs. Underfunding of programs at the Division of Waste Management is a major impediment to further progress in Kentucky.
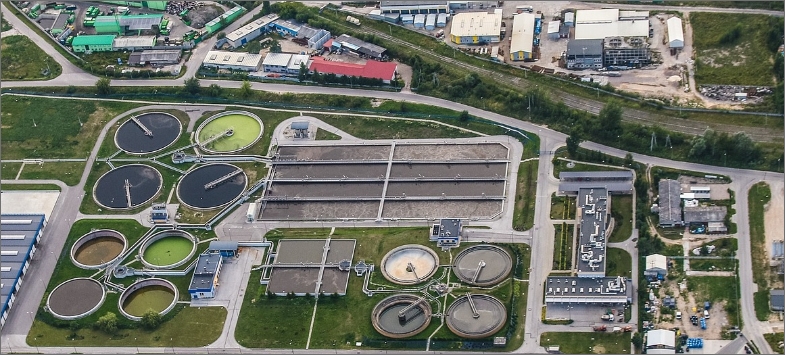
Wastewater
Nearly 20 years ago, the governor of Kentucky issued an Executive Order to provide water and wastewater service to every Kentuckian by the year 2020. In response, a strategic plan for wastewater was developed in early 2000, which provided recommendations to be carried out over the next 20 years. Many of the original recommendations have already been implemented, and it is important to recognize the improvements that have been made over the past two decades. However, the Commonwealth of Kentucky is faced with treatment facilities that are an average of 36 years old, as well as aging pipelines that send wastewater to the treatment plants. Some of these pipes are more than 70 years old, and many of them are large-diameter pipes that have the greatest impact on a community when they fail. Meanwhile, 40 percent of Kentuckians rely on septic tanks or other private systems, the condition of which is generally unknown. The 2012 Clean Watersheds Needs Survey (CWNS) indicated $6.2 billion in needs for wastewater projects in Kentucky. Aging wastewater infrastructure and a lack of funding needed to implement all necessary improvements are of concern.

97% of people in Kentucky get water from water utilities, and the state has taken action to make water utilities serve more people with greater efficiency.
State Fact Sheet
Download Fact Sheet
14,590
Bridges
8%
of Bridges are Deficient

27
High Hazard Dams

$20.4B
in Drinking Water Needs

150 Miles
of Levees
Protecting 291,000 people

31%
of Roads in poor or fair condition

$ 559
Motorist pays annually
due to insufficient infrastructure
16.0M
Passenger Trips on Public Transit
$27.1B
Wastewater needs

$28.9B
Total storm damage
(1980-2024)

IIJA Grants
IIJA Funding Announced
Number of IIJA Projects
Brent-Spence Bridge: This $1.6 billion award will upgrade the Brent-Spence Bridge connecting Covington, Kentucky, and Cincinnati, Ohio, resulting in improved interstate and local traffic flow on one of the nation’s worst truck bottlenecks, which currently carries more than $400 billion in freight annually.
Kentucky Lock and Dam: This $465 million award will build a new, larger lock at Kentucky Lock near Paducah, resulting in improved navigation for modern barges and reduced supply chain pinch points, enabling the efficient transport of 57 million tons of goods annually.
Panbowl Lake Corridor Project: This $21 million award will construct corridor improvements including a sidewalk, shared-use path, bike lanes, and a widened roadway, as well as replace the flap gate structure and install an additional sluice gate, resulting in safer, low-cost transportation options and improved freight mobility, goods movement, and travel time reliability.
Connect with Your Legislators
Let everyone know how important it is that we continue to invest in the future of America’s infrastructure.
Take Action Today