
2025 Report Card GPA: C
The American Society of Civil Engineers (ASCE) Texas Section has been developing infrastructure report cards since 2004. Assessing Texas’ infrastructure is a big task, so why do it? Well, at some point in our history, members began to ask questions about our infrastructure. How is it performing? What are the areas that need immediate attention? How do we prioritize our funding? How much funding is needed? Civil engineers perform studies, design, and evaluate various infrastructure systems to answer these very questions. Understanding the interconnectedness of infrastructure systems, as Texas residents experienced in 2021 during the winter storms, answering these questions gives us guidance on how to invest and develop policy which allows our infrastructure to be effective. Infrastructure is the foundation of our economy, safety, and quality of life and these report cards aim to evaluate and grade the systems in order to provide a clear picture of the current state of our infrastructure. It also aims to be a resource for informed decision-making by policymakers, stakeholders, owners and the general public.
The original report card was simple, with a few comments just to the left of the grade, resembling grade school report cards. Since then, not only has Texas grown, but so too have ASCE Texas Section membership, resources, and volunteers. We have since produced four more report cards with the 2025 release being our 6th Texas Infrastructure Report Card. Each release has evolved in presentation and format, with the 2017 and 2021 reports having more in-depth discussion on the various categories. This release follows that same format and is made possible by our 56-committee member volunteers whose efforts have led to meaningful and passionate discussions to recommend a grade based on the assessment. We are thankful to all our committee members who have dedicated over a year to this effort.
The 2025 report recognizes improvements and declines in specific areas and sectors of infrastructure. Two infrastructure sectors worth mentioning are Energy and Transit to prepare the reader for the letter change in grade. In Energy, the updated grade reflects a more comprehensive evaluation of electric and non-electric, to understand how the flip of a switch actually turns on the lights. Winter Storms Viola and Uri revealed the interdependence of systems and networks to assess the reliability issue we faced in 2021. The updated chapter includes generation, transmission, and distribution of both electrical systems and liquid fuels, as well as market analysis impacts. In Transit, the change in grade now considers the data across Texas, noting that although investments have been made in metropolitan areas, many agencies still need support to meet the growing demands of all Texas commuters.
The ongoing evaluation of our infrastructure is essential for prioritizing investments and ensuring that Texas remains a thriving state. The report cards serve as a valuable tool for advocating for necessary improvements and innovations in infrastructure. Advocacy works. When a group of like-minded people gather to share the same story in different but personal ways, change happens. Using this resource and ASCE Key Policy Statements, every biennial year, members come together and share their personal stories with policy makers.
Ultimately, our goal is to ensure that Texas has robust infrastructure that can support its growing population and future demands. Through our collective efforts, we strive to inspire positive change and build a brighter future for all Texans.
Read the executive summary here.
-
Explore Texas
- Grades
- State Fact Sheet
- IIJA Grants
Texas Infrastructure Grades
A: Exceptional, B: Good, C: Mediocre, D: Poor, F: Failing
Each category was evaluated on the basis of capacity, condition, funding, future need, operation and maintenance, public safety, resilience, and innovation
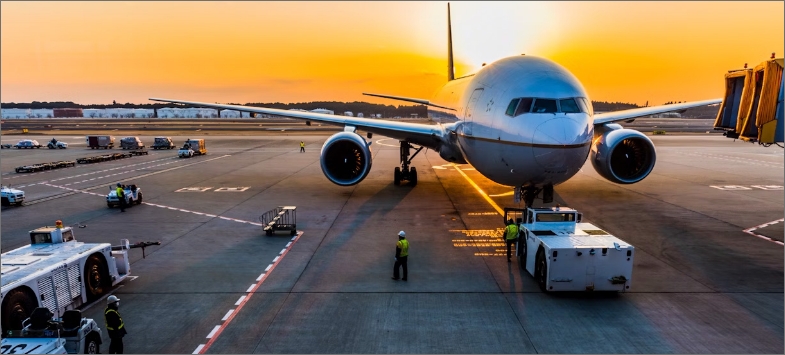

Aviation
Texas remains a crucial geographic hub for domestic and international air passenger travel, as well as air freight, boarding 90 million passengers and reported moving three million tons of cargo in 2022. Texas has six of the top 50 busiest airports in the US. The airfield infrastructure condition remains good overall. As passenger traffic returns to or exceeds pre-pandemic levels, strains are placed on terminal facilities. Airports have used the Federal Aviation Administration (FAA), Infrastructure Investment and Jobs Act (IIJA), and local funds to increase terminal capacity over the last several years. General Aviation airports continue to grow, with 9,100 aircrafts based throughout the state and 5.7 million operations contributing approximately $2.5 billion to the state economy. Texas has made significant progress in bridging the funding gap thanks to increased state funding alongside federal support, enabling a substantial rise in planned projects for the upcoming years.
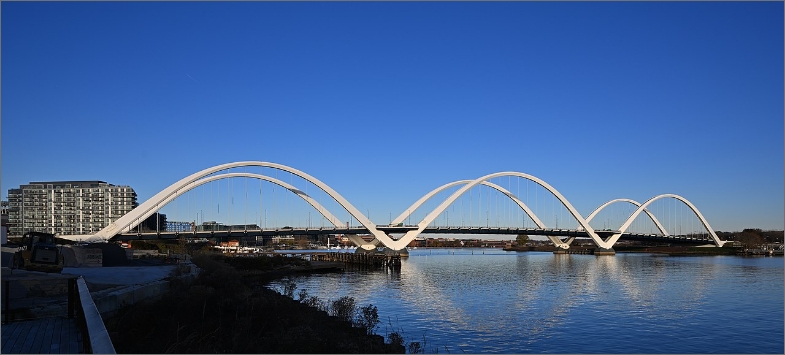
Bridges
Bridges in Texas include 56,000 bridge structures and bridge-class culverts, which support 616 million vehicles daily. Ongoing investment and maintenance are necessary to support Texas’ growing economy and population, which currently exceeds 30 million and is projected to increase 34% by 2050. Despite significant efforts, including an annual investment of $1.1 billion to expand bridge capacity and $736.4 million for preservation, funding remains insufficient to meet anticipated demands. A significant challenge is addressing aging infrastructure. Over 42% of bridges were constructed before 1974. Tackling these challenges requires innovation in technologies and resilient design. The state’s proactive measures in public safety and bridge inspection programs have reduced the percentage of bridges in poor condition from 1.26% to 1.23%. The longevity and safety of Texas’ bridge network will rely on substantial annual future investments, estimated at $2 billion for expansion and $1.8 billion for maintenance.

Broadband
Texas is actively working to improve broadband access through federal appropriations and state-level initiatives. The digital divide in Texas persists due in part to infrastructure limitations, cost of deployment, service affordability challenges, and digital literacy gaps. This digital divide affects nearly one-quarter of the state’s population, primarily those in rural and remote areas. Broadband access is crucial for virtual learning, telehealth, online commerce, and economic opportunity. Closing the digital divide remains essential to ensure equitable access for all Texans. Expanding broadband infrastructure across the state can be challenging due to its size. Regardless, with strategic investments, cross-functional collaboration, and a process to apply for funding, the state can bridge the digital divide and ensure that all Texans benefit from fiber-broadband access. However, additional comprehensive data for broadband is necessary to thoroughly assess infrastructure, deployment progress, and federal and state programs.
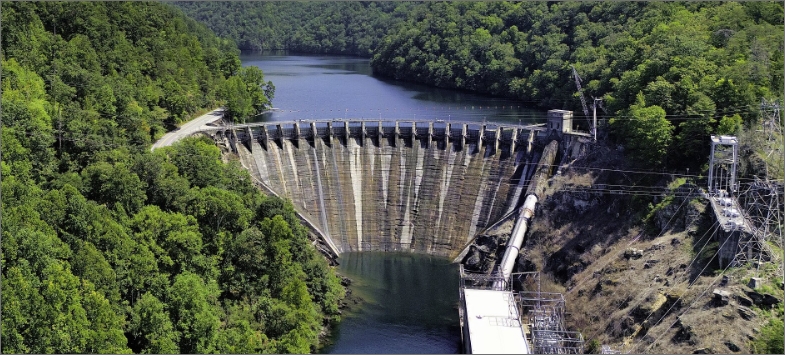
Dams
Dams in Texas serve many purposes, including recreation, flood risk mitigation, irrigation, water supply, and fire protection. About 1 in 3 of the state’s dams address flood risk mitigation, and one in seven support irrigation or water supply. Dams carry significant value and substantial risk, as failures can result in loss of life and property. Of the estimated 7,378 non-federal dams, approximately 25% could result in loss of life should they fail. Underfunded and understaffed regulatory agencies compromise the safety of these structures. Over 3,200 Texas dams are exempt from dam safety requirements by state legislation. In 2023, the Association of State Dam Safety Officials (ASDSO) estimated $13.6 billion to rehabilitate all non-federal dams in Texas. The Texas State Soil and Water Conservation Board (TSSWCB) estimates that about $2.1 billion is needed to repair or rehabilitate dams included in the Small Watershed Programs.

Drinking Water
Funding safe and adequate drinking water supplies is essential to continue fostering growth and prosperity and is imperative to the State’s economy. The importance of planning for adequate water supplies is demonstrated by Texas’ legislation that requires the Texas Water Development Board (TWDB) to develop a State Water Plan (SWP). The SWP is updated every five years and incorporates sixteen regional water plans, which guide the state water policy. The state population is projected to grow from 32.9 million in 2030 to approximately 53.2 million by 2080. Additionally, the number of boil water advisories has doubled from 2020 to 2023, indicating a need to address aging infrastructure and for additional investments across infrastructure operation and maintenance. Furthermore, the number of Public Water Systems with limited water use to avoid shortages has increased from 46 in 2019 to 571 systems in 2023, affecting approximately 6.4 million people.
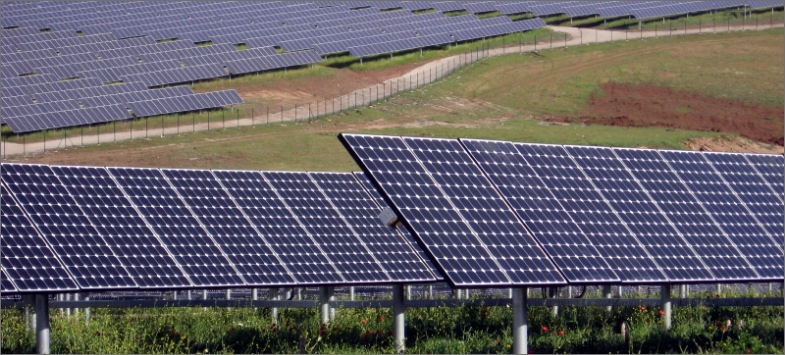
Energy
Texas supplies approximately 25% of the nation’s energy needs. The uniqueness of our State’s energy requires a comprehensive and separate analysis of the electric and the non-electric energy produced to understand the critical reliability and resilience issues while evaluating the integrated requirements throughout the system. Texas’ energy infrastructure system introduces two characteristics different from other infrastructure systems. First, market forces, influenced by regulations, drive investments in expansion, reliability, and resilience. Second, investments are predominantly underwritten by private markets. Recent extreme weather exposed underinvestment problems in the transmission & distribution network and revealed shortcomings in storm response and resilience. The Texas energy sector faces many challenges that are further complicated by lagging regulation, market uncertainty, unprecedented demand growth with an increasing population, and private industry, like data center expansions. Recent legislative solutions have continued to be tested by extreme weather and demand, leaving Texas’ energy infrastructure vulnerable.

Hazardous Waste
Over the past four decades, the Texas Commission on Environmental Quality (TCEQ) has effectively managed over 19 million tons of hazardous waste through state regulations aligning with federal hazardous waste infrastructure standards. Texas programs, supported by public and private funding, have improved to meet the demands of increasing hazardous waste generation from our booming economy. Limited TCEQ staffing hampers these efforts with the agency’s ability to address challenges such as the increasing number of EVs and the potential surge in large waste batteries, emerging contaminants like PFAS, and rising sea level threats to contaminated sites, all adding to future needs. Texas must tackle these unknown and unquantified challenges. Over the next 20 years, a dedicated focus must be on recycling, reuse, waste diversion, pollution prevention, industrial process minimization, reducing air pollution emissions from hazardous wastes, and managing new hazardous waste influxes from EVs and new renewable energy products. Policy development and guidance are necessary to address emerging issues. Partnerships with academic institutions can support efforts to review regulations and address future concerns. Due to hazardous waste management and remediation costs, the private sector must continue funding most improvements. New or revised regulations and policies to incentivize markets will ensure changes are commercially driven and build on existing private sector growth and investments.
Levees
Texas relies on a network of levees to protect communities from hurricanes, storms, and floods. There are 234 levee systems throughout the state, providing 1,342 miles of protection for 1.5 million residents. The levee systems also safeguard 431,478 properties on approximately 208,382 acres of agricultural land, having a collective value of $248 billion. This economic impact underscores the crucial importance of the levee systems in Texas’s infrastructure to mitigate the effects of floods. While rare, failures can and do occur. The system continually faces stressors, which test the infrastructure’s integrity, with increasing frequency and storm intensity. The remaining challenge exists to comprehensively manage the state’s existing levee infrastructure assets and provide funding to owners of levees. Accuracy in the inventory of assets will support directing funds to necessary entities and remove inaccurate presumed deficiencies.
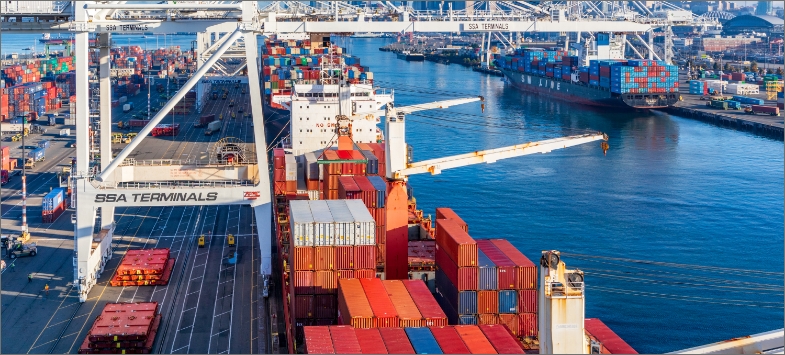
Ports
Texas ports handle over 600 million tons of cargo annually and are the nation’s top exporter by tonnage. According to the Texas Ports Association (TPA), ports in Texas are essential to the state and generate $450 billion in total economic value. Several factors impact port operations as waterborne tonnage continues to expand due to economic activity. These factors include increased ship sizes and traffic in ship channels, resiliency in the face of more frequent storm events, increased demands for cybersecurity, and rising construction and equipment costs. The overall condition of Texas ports is good, but significant improvements and expansions are required to mitigate the factors affecting operations. Since 2010, Texas’ population has increased by 19% or roughly 5 million people, and Texas ports require increased funding to maintain this growth and economic prosperity for the state.
Public Parks
Texas contains some of the most diverse public lands in the country, including 14 national parks, 88 state parks, and numerous county & local parks covering 70 million plus acres, which showcase natural treasures and community greenspaces. The Texas Parks and Wildlife Department (TPWD) is the state agency whose mission is to manage and conserve the natural and cultural resources of Texas and to provide hunting, fishing, and outdoor recreation opportunities for the use and enjoyment of all generations. Multiple allocations and appropriations passed by the Texas Legislature help fund TPWD. The 2025 fiscal year budget of $534.1 million supports state parks’ operation, maintenance, and protection, but historically, funding has fallen short due to diversions. Texans, however, passed Proposition 14 in 2023, which created a centennial parks conservation fund to invest more than $1 billion to establish and improve state parks. In 2021, Texas voters approved Proposition 2, which authorized county infrastructure bonds to improve blighted areas for county and local parks. Additionally, recent voter approval in several municipalities, cities, and counties to increase bond funding for park infrastructure demonstrates Texans’ commitment to parks. Parks preserve scenic natural treasures and conserve wildlife and their habitats while allowing the public to enjoy recreational resources. Meanwhile, state parks also serve as emergency shelters during crises such as hurricanes and floods. With over 95% of Texas land privately owned, counties and cities depend upon donations to acquire properties and designate them for public use. However, because of Proposition 14, additional funding will help secure the future of state parks for generations to come.
Rail
Texas has the largest rail network in the country, with more than 10,400 miles of track and a substantial number of Class I railroads, short lines, and regional rail operators. In particular, freight rail in Texas plays a critical role in the state’s economy, given its size and position as a central transportation hub for the U.S. Both freight and passenger rail receive private and public funding that ensures rail continues to be a key part of the transportation network in Texas. The state’s freight rail system handles various commodities, including oil, gas, agricultural products, chemicals, and consumer goods. It is funded predominantly by private investment from railroad companies like Union Pacific Railroad (UP) and Burlington Northern Santa Fe Railway (BNSF), with occasional public support for projects that benefit the broader economy or public infrastructure. Freight rail is generally in better condition than Passenger Rail. Current passenger rail services run (through agreements) on the existing Freight Class I rail network. There is no High-Speed Rail (HSR) currently operating in Texas. Federal and state governments provide subsidies, particularly for Amtrak, with opportunities for private investment in special projects like HSR. Public funding also supports safety improvements and new rail corridors.
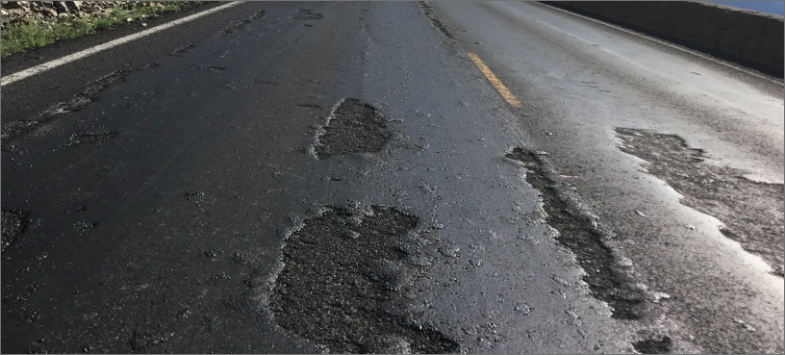
Roads
Texas boasts an expanding massive road network to keep pace with a growing population driving 51.2 billion miles in 2023. Rising congestion, up 7% over 2021, is an ongoing challenge and requires funding and innovation to maintain the good pavement conditions of nearly 90% of our roads. Texas tackles congestion by dedicating significant resources to roadways and exploring innovative solutions such as traffic flow technology. Safety remains essential, with 4,268 fatalities in 2023, $3 billion is allocated for safety projects. Despite public awareness campaigns and other projects, fatalities persist, which have prompted many local Vision Zero initiatives. Funding for our roads comes from sources such as the Infrastructure Investment and Jobs Act (IIJA), gas taxes, registration fees, bond programs, and new electric vehicle fee. Continued increases in the number of vehicles emphasize the need for continued investment. The Texas Department of Transportation (TxDOT) is preparing for the future by planning to invest over $37.2 billion for development, delivery, and maintenance of state highway projects to facilitate safe travel on our roadways. Overall, Texas is working diligently to keep its transportation system moving.
Solid Waste
Texas’ population continues to grow, and with that comes an increase in the amount of waste generated, 39.73 million tons. The 2022 Data Summary report published by the TCEQ found that Texans’ average disposal rate of 7.25 pounds per person per day continues to climb at rates that exceeded the national average. The United States Environmental Protection Agency (EPA) delegates the authority to permit and regulate all municipal solid waste (MSW) facilities in the state to the TCEQ, while a combination of public and private entities provides solid waste management services in the state. Texas currently has an average of 51 years of reserve capacity statewide, but continued population growth will result in an uneven distribution of Texas’ reserve waste disposal capacity. Most large metropolitan cities in Texas have robust recycling collection programs and access to infrastructure to divert material from direct disposal. However, some urban and many rural areas still lack access to recycling programs due to a shortage of infrastructure and process centers. While a new recycling facility opened in San Antonio in August 2024, that is the only one scheduled to come online, which will not keep pace with the growing population. A general lack of recycling facilities continues to be a problem in the state, where municipalities have difficulty funding their annual budgets. Over the next four years, improvements in solid waste recycling and diversion would provide more options for Texas’ solid waste management programs.
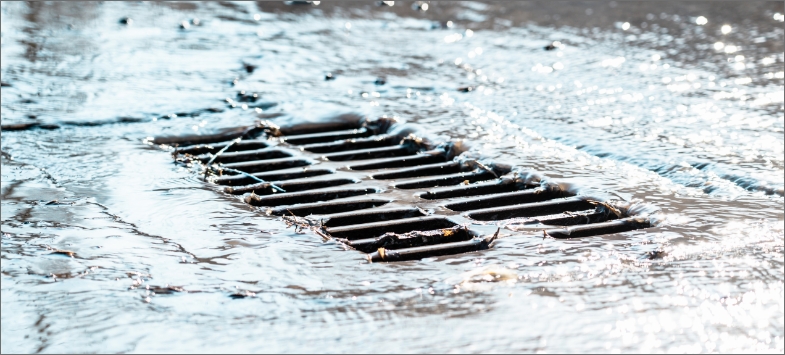
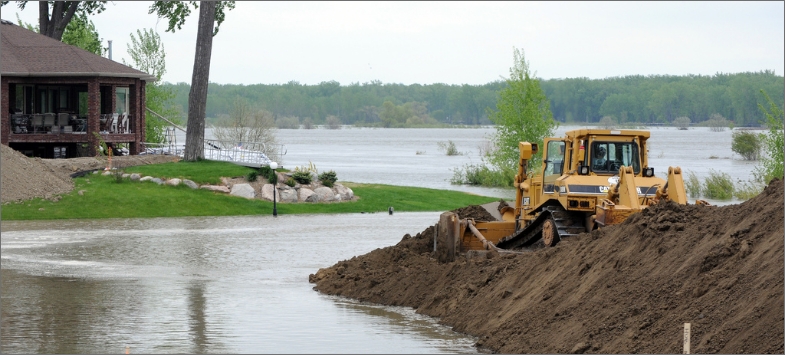
Stormwater
According to the 2024 State Flood Plan, nearly 5 million Texans currently live or work in high-risk flood zones, and with projected population growth and increasingly severe storms, it is critical to improve stormwater infrastructure. While it is nearly impossible to eliminate all flood risk during extreme storm events, state and local leaders have advanced strategies to enhance the technical analysis of risk, developed risk mitigation and resilience solutions, and identified and dedicated the necessary funding. The Texas Water Development Board (TWDB) completed Texas’ first comprehensive State Flood Plan in 2024, a herculean effort identifying flood risk across the state and consolidating recommended solutions from 15 flood planning regions. The estimated cost to develop solutions is over $54 billion and includes, studies, design, and construction projects.
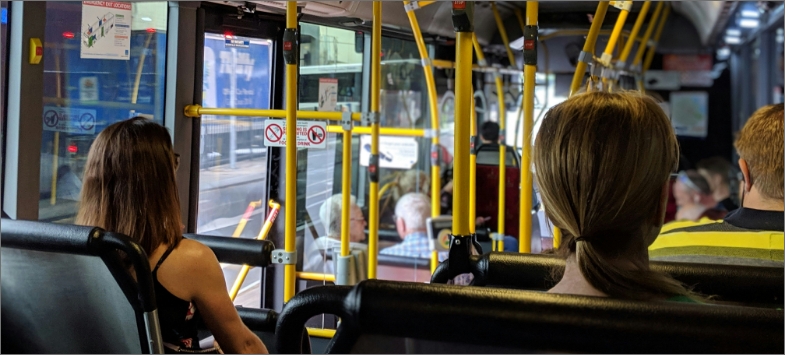
Transit
Public transit services in Texas are provided primarily by three entities: rural transit districts, large and small urban transit districts, and metropolitan transit authorities. Across the state, public transit ranges from light rail and bus services to on-demand and curb-to-curb shuttle and van rides. A combination of federal, state, and local funding mechanisms helps fund Texas Transit. The Texas triangle (Dallas-Fort Worth-Houston-San Antonio/Austin) continues to experience rapid growth. Texas now has 42 cities with a population of 100,000 people or more and a non-urbanized population of 6.9 million, accounting for only 24% of the total state population. Eight metropolitan authorities, 32 large and small urban area transit districts, and 36 rural transit districts accounted for 205 million rides in 2023, with 89% of those rides taking place within the area of the metropolitan districts. Ridership is up from the previous year and continues to recover from the effects of the COVID-19 pandemic. Service has returned to within 2% of pre-pandemic levels, and ridership is at approximately 75% of pre-pandemic levels. As Texas’ population grows and urbanizes, project costs increase, and right-of-way becomes limited, transit will become an increasingly important travel mode. Funding transit will be critical. According to a 2018 report, multi-year capital needs for transit in Texas require an annual funding level of approximately $4 billion.
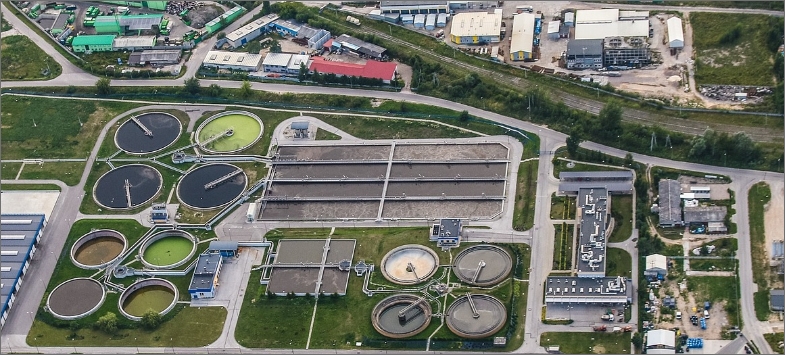
Wastewater
The wastewater sector in Texas is currently resource constrained, whether it’s funding from federal, state, or local agencies, personnel for operating and maintaining wastewater infrastructure, or science and engineering professionals needed to develop quicker, cost-effective, and resilient solutions. The growing population is not only adding demand but also expanding and increasing decentralized systems permits by 30%. Furthermore, the funding available from federal and state sources falls short of effectively meeting the demands for new infrastructure and rehabilitation. Although innovative and resilient efforts in wastewater initiatives are underway, the essential funding significantly surpass these efforts. To improve the current wastewater infrastructure conditions, the wastewater industry must secure additional funding for new infrastructure, rehabilitation, and replacement of existing systems. Funding may require educating wastewater users on issues impacting functionality of the system alongside implementing rate increases. Additionally, discussions with Federal and State government officials regarding future wastewater funding opportunities are necessary. Texas wastewater professionals will continue to find more innovative, resilient, cost-effective solutions that both protect the state’s natural resources and improve its infrastructure.
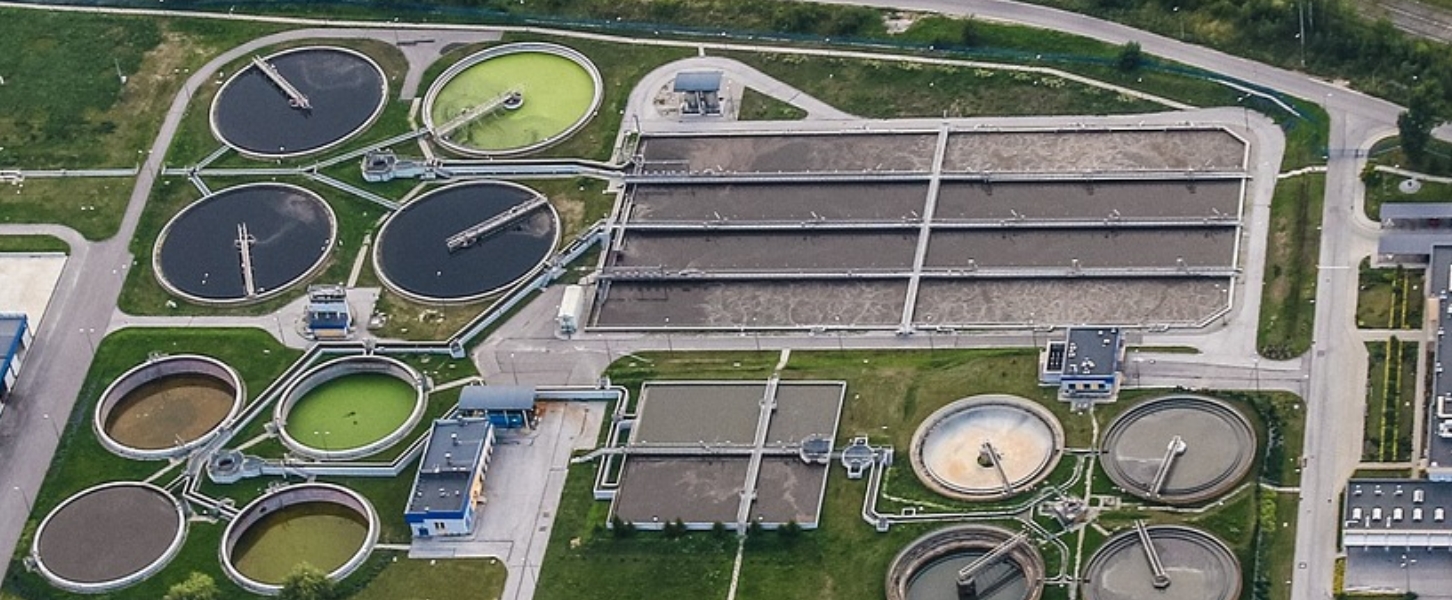
Texas has $18.9 billion in wastewater investment needs, and housing developments have meant a 30% increase of decentralized system permits.
State Fact Sheet
Download Fact Sheet
56,951
Bridges
1%
of Bridges are Deficient

1607
High Hazard Dams

$144.3B
in Drinking Water Needs

1288 Miles
of Levees
Protecting 1,540,000 people

47%
of Roads in poor or fair condition

$ 959.36
Motorist pays annually
due to insufficient infrastructure
227.8M
Passenger Trips on Public Transit
$94.1B
Wastewater needs

$436.1B
Total storm damage
(1980-2024)

IIJA Grants
IIJA Funding Announced
Number of IIJA Projects
Bus Rapid Transit Corridor: This $150 million award will develop a Bus Rapid Transit corridor connecting Westchase Park-and-Ride to the Tidwell Transit Center, expanding high-capacity transit options and improving regional mobility.
Flood Resilience Improvements: This $50 million award will protect a major wastewater treatment plant and a power plant in Austin, TX, from worsening flood risks, ensuring critical services remain online during severe weather events.
Anzaldúas Bridge Expansion Project: This $25 million award will build commercial inspection facilities at the Anzaldúas Land Port of Entry, adding booths, docks, equipment, roadway, parking, and sidewalks. The project will upgrade southbound facilities and construct northbound facilities, improving safety, efficiency, and travel time reliability while enhancing economic competitiveness for cross-border freight.
Connect with Your Legislators
Let everyone know how important it is that we continue to invest in the future of America’s infrastructure.
Take Action Today