
2023 Vermont Infrastructure Report Card
2023 Report Card GPA: C
Members of the Vermont section of the American Society of Civil Engineers volunteered to produce the 2023 Report Card for Vermont’s Infrastructure. This report serves to educate the public on the status of the infrastructure in the state of Vermont. Residents, in conjunction with elected officials, can therefore better prioritize limited funding among competing, connected needs to improve the condition, capacity, operations, maintenance, safety, innovation, and resilience of infrastructure.
Overall, Vermont’s infrastructure gets a ‘C’, the same as the 2019 report card. Progress is real, but challenges remain. Vermont has some of the oldest infrastructure in the country. Substantial maintenance backlogs have accrued in several areas as recent investment runs into new challenges such as inflation, shortage of a trained workforce, and a deficit of resiliency to withstand climate change.
Since the previous report card, legislative support for infrastructure, public agency planning, and influx of COVID-19 pandemic relief funds deployed amid historic challenges. Vermont allocated federal pandemic funds to the water, sewer, and wastewater sectors in addition to other economic development and climate change mitigation measures. Congressional support was also used to expand Vermont’s broadband infrastructure, a critical need in a rural state, the lack of which impacted people forced to learn and work from home during the public health emergency.
Dollars brought in through the 2021 Bipartisan Infrastructure Law provide ways to create tangible improvements in the status of several categories of infrastructure assets. However, maintenance and related slowdowns during the pandemic also set some sectors back. Aviation raised to a ‘C’: recent upgrades have been focused on airport capacity, including the expansion of the Burlington International Airport (BTV) apron and the construction of a 37,000-sf addition to the terminal building. Safety upgrades included BTV terminal and airfield access control system rehabilitation, perimeter fence installation at various state airports, and removal of obstructions at all airports. Bridges climbed to ‘B-.’ In the last few years, the number of poor condition bridges in Vermont has decreased to 2.4% of the inventory – down from 5% in 2017 and well below the national average. Roads stayed at ‘C+,’ but Vermont experienced a surge in traffic deaths, which increased every year since the 2019 report card – doubling from 0.64 to 1.2 fatalities per 100 million vehicle miles traveled.
COVID-19 also transformed how people use infrastructure, and how it is managed, along with what funding was available. The temporary influx of funding provided a boost, but the state’s infrastructure needs continue to pose a challenge as is reflected in lowered grades across multiple sectors as compared to the 2019 levels. Aging infrastructure has led to failed wastewater treatment systems, and combined sewer overflows. Global supply chain issues have impacted the progress of project implementation across multiple sectors and shortages in a trained workforce are especially challenging the resilience of a small rural state like Vermont to meet the needs of its residents.
Read the executive summary here.
-
Explore Vermont
- Grades
- State Fact Sheet
- IIJA Grants
Vermont Infrastructure Grades
A: Exceptional, B: Good, C: Mediocre, D: Poor, F: Failing
Each category was evaluated on the basis of capacity, condition, funding, future need, operation and maintenance, public safety, resilience, and innovation
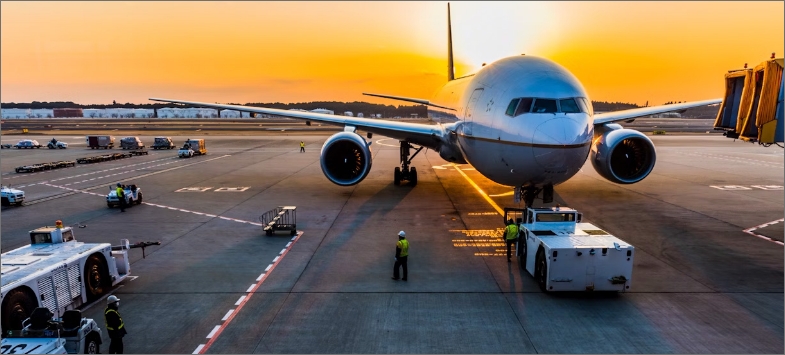

Aviation
Vermont is home to 16 public-use airports, 12 of which are included in the National Plan of Integrated Airport Systems (NPIAS). A 69% year-over-year reduction in passengers served and 33% drop of scheduled flights in 2020 temporarily alleviated Burlington International Airport’s (BTV) terminal capacity challenges before the COVID-19 pandemic. Federal funds secured in 2021 allow BTV to increase its terminal apron and construct a 37,000-sf addition to the building for flight and passenger growth. All of Vermont’s NPIAS facilities have “fair” or better pavement condition with most runways “good” or “excellent.” Increased state funding and fee increases would close a projected funding gap for 2023 through 27. BTV’s estimated investment need in those years is $73 million, plus $66 million for the other state airports – compared to a projected $61 million and $25 million funding availability, respectively.
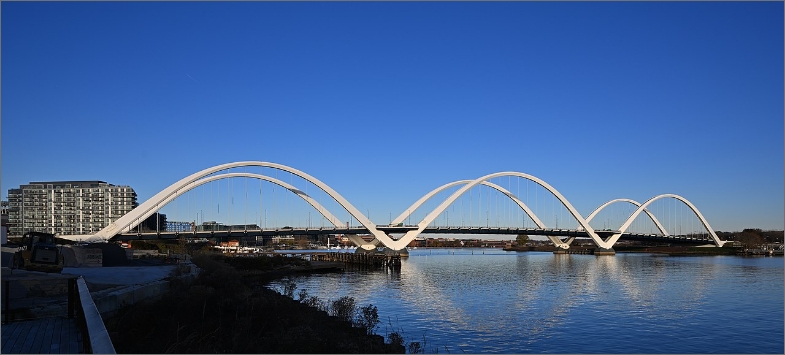
Bridges
In the last few years, the number of poor condition bridges in Vermont has decreased to 2.4% of the inventory – down from 5% in 2017 and well below the national average. Thanks to the federal 2021 Bipartisan Infrastructure Law, Vermont’s FY 2023 transportation program shows an increase in federal funding for bridge projects of approximately 27% compared to the average federal contributions over the previous four fiscal years. Although the number of poor condition structures decreased, their age is increasing. In comparison to the national average bridge age of 44 years, Vermont’s bridges average 59 years. Despite the progress made on bridges in the National Bridge Inventory, the older age and worse condition of shorter span bridges in and culverts in Vermont requires greater attention in the coming years. Increased funding for replacements, development of efficient designs, and innovative construction methods will be needed to improve the condition of these structures.
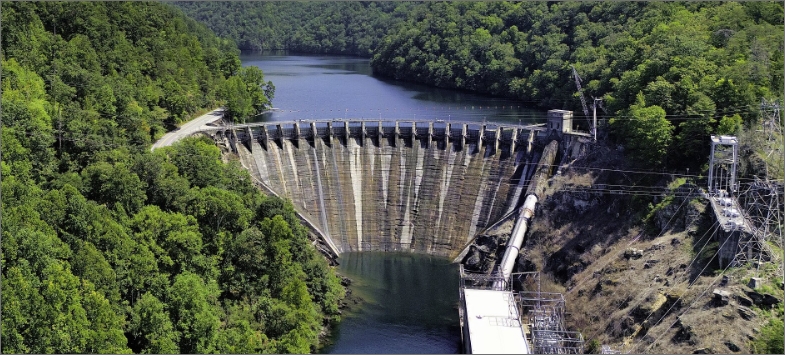
Dams
Vermont’s 1,115 dams serve a variety of purposes, including recreation, flood-control, and hydropower. 6% of Vermont dams are high hazard – if they fail loss of life is probable, as are damages to property and the environment. In the past four years, dam inspections went up 30% and the number of Vermont’s dams known to be in poor condition dropped from 40% to 31%. Two dams experienced partial failure in the past four years. Higher sustained funding will improve the Vermont dam safety program such as by increasing permanent staff to six FTEs from today’s two. Temporary funding has supported nineteen dam removals in the last four years. Additional federal money from the Bipartisan Infrastructure Law will help improve dam safety and removal of obsolete, decaying dams, but private and municipal dam owners report greater financial assistance is needed for maintenance and operations changes necessary to comply with recently improved dam safety regulations and needs identified in a 2022 State Auditor report.

Drinking Water
As of 2020, Vermont’s drinking water assets included approximately 1,382 active public water systems serving 59% of the state’s 645,000 residents. Those utilities average higher than 95% compliance with state and federal laws. Most water systems in Vermont are not expanding in size or demand, but aging infrastructure needs to be replaced. A 2019 state law expanded safety testing in public buildings and has already identified thousands of immediate repair needs. A 2021 University of North Carolina study found the median water utility in Vermont collects operating revenue of $296,000, which only barely funds its $284,000 annual expenses – before counting capital projects. The state expects to receive $355 million over five years from the 2021 Bipartisan Infrastructure Law – compared to a $374 million funding need identified by the legislature that year. Most of those federal funds will address emerging contaminants and lead service line replacements. Vermont’s average monthly water bill is $46, compared to the national average of $68, creating a structural funding gap as climate change threatens aging water systems.
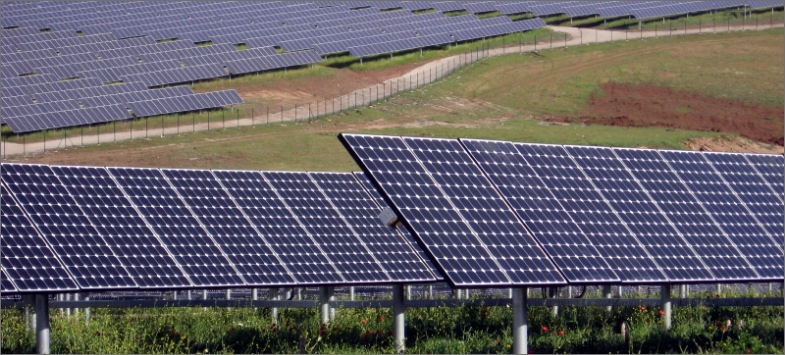
Energy
Vermont households use less energy than 80% of American states. Despite that efficiency, Vermont consumes more than three times as much energy as it produces. Importing that extra power leads to some of the highest rates in the nation: on average $0.19 per KWh for residential, as of February 2022. In 2020, 100% of the electricity generated in Vermont was from renewable sources. Recent plans outline ambitious goals for shares of energy used with renewables, 45% of transportation use by 2040 and 70% of heating by 2042. Electrical transmission infrastructure is a significant constraint on these changes. By the end of June 2021, Vermont had approximately 266 MW of solar capacity installed, but power lines can’t carry that volume around Vermont or to other New England states. Increased transmission capacity, resilience, and interconnection is required for Vermont to utilize current and future renewable generation – and to meet growing demand from electrification in residential and commercial use.
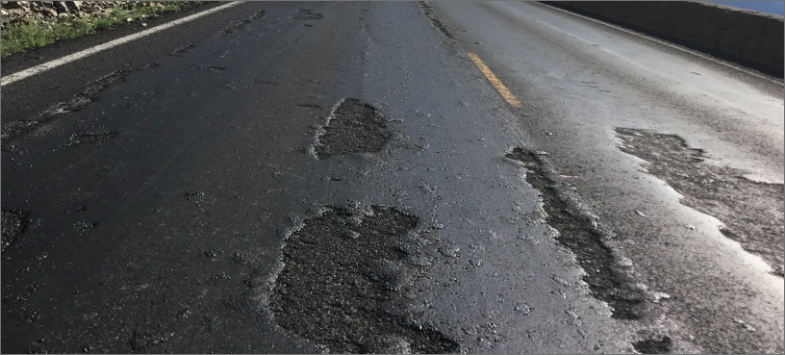
Roads
Vermont’s roadway system totals 14,250 miles, 80% of which are maintained by the Vermont Agency of Transportation (VTrans) and the remaining 20% run by 237 municipalities, with no county-level ownership. In 2022, average weighted pavement condition across the network was 68 – compared to the state goal of 70. 39% of roadway surfaces were in good condition, compared to 45% in the 2019 report card, and 31% rated fair compared to 25% in the previous report. While Vermont’s motor fuel taxes are higher than nearby states, their portion of state-level transportation funding (31% in FY23) is lower than fee revenue. VTrans budget grew 20% annually to $434 million in FY23, thanks in part to the 2021 Bipartisan Infrastructure Law, helping improve resilience of roads to more frequent, harmful storm events. Workforce development – retention and new talent pipelines – are necessary to meet those challenges and a surge in traffic deaths, which increased every year since the 2019 report card – doubling from 0.64 to 1.2 fatalities per 100 million vehicle miles traveled.
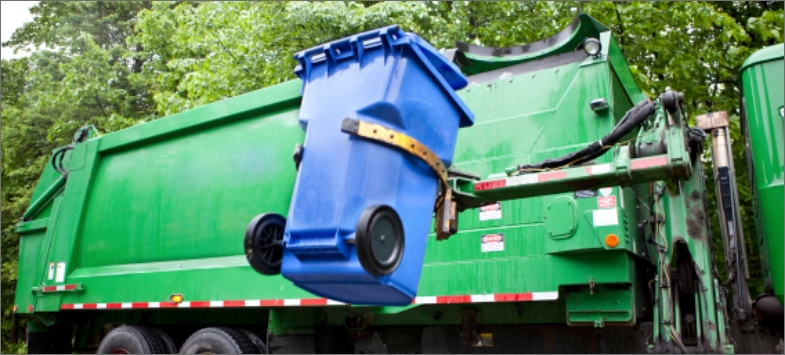
Solid Waste
In 2021, approximately 639,835 tons of municipal solid waste (MSW) were generated in the State of Vermont. Of that, about 219,501 tons – 34 percent – of material were recycled or otherwise diverted from landfills or incinerators. That diversion rate is consistent with the 34% average of the last 10 years and much lower than Vermont’s 50% goal by 2024. Vermonters disposed of MSW at an average of 1,302 pounds per person per year in 2021, much above the State’s 2024 goal of 1,000 lbs/person/year. Vermont’s Solid Waste Infrastructure Advisory Committee determined that approximately $45 million (in 2015 dollars) was needed to meet these goals. A structural flaw should be corrected in Vermont’s solid waste funding model: funds are generated in proportion to the amount of trash disposed and Vermont’s goal is to minimize that total while maximizing amount diverted.
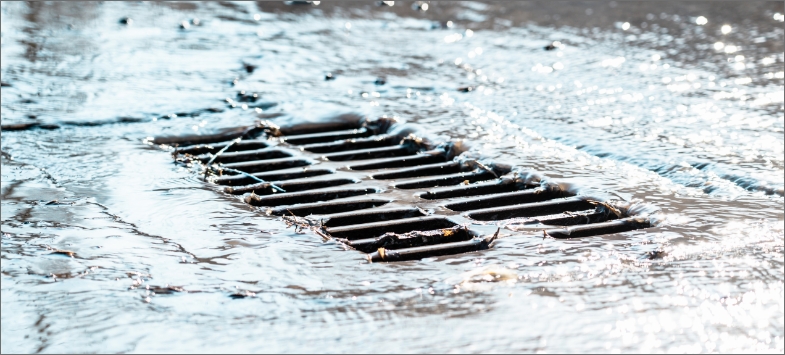
Stormwater
Stormwater runoff can be harmful to the health, safety, and performance of the built or natural environment. Vermont made a positive step in 2022 reducing the minimum requirement for stormwater engineering in developments down to 0.5 acres of impervious surface area, and more thorough stormwater permits if greater than 3 acres. Such area shuttles stormwater at too high an intensity and volume for the watershed to safely absorb it. 2015’s Act 64 and subsequent changes have enabled the establishment of 17 stormwater utilities reporting 11.5 million gallons of untreated stormwater runoff in 2022. Vermont’s state government should assist communities with new state financial support and help accessing new federal funding to meet a $2.3 billion need over 20 years to grow public works capacity to construct, collect data on, and interconnect stormwater infrastructure.
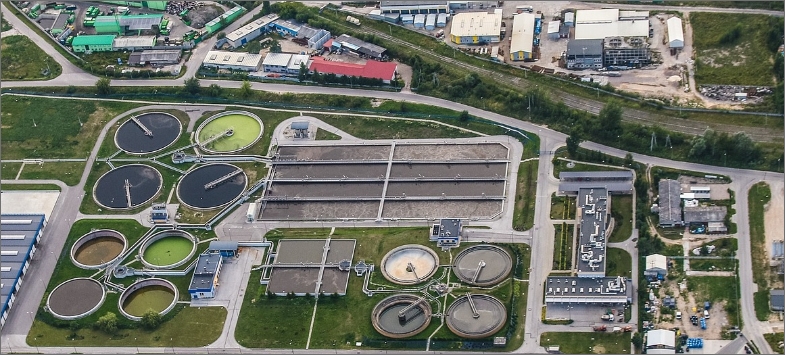
Wastewater
50% of Vermonters are served by 116 municipal, direct discharging permitted wastewater treatment facilities (WWTFs), with the remainder of residents served by 252 larger, shared soil-based wastewater system or individual on-site septic systems where connections to larger systems are not possible or feasible. On-site septic systems treat wastewater for Vermont’s remaining residents. Old infrastructure and operations led to 144 combined sewer overflows from 2020 through 2022. From 2018 to 2021, permits issued annually to repair failed wastewater systems grew from 510 to 641. Annual wastewater infrastructure investments from Vermont declined from $29 million in 2018 to $12 million in 2021. The 2021 American Rescue Plan Act sent one-time funds to the state – of which $30M was used for treatment of combined sewer and sanitary sewer overflows. Sustained investment is necessary to meet goals for decreasing harmful chemicals and increase resilience.
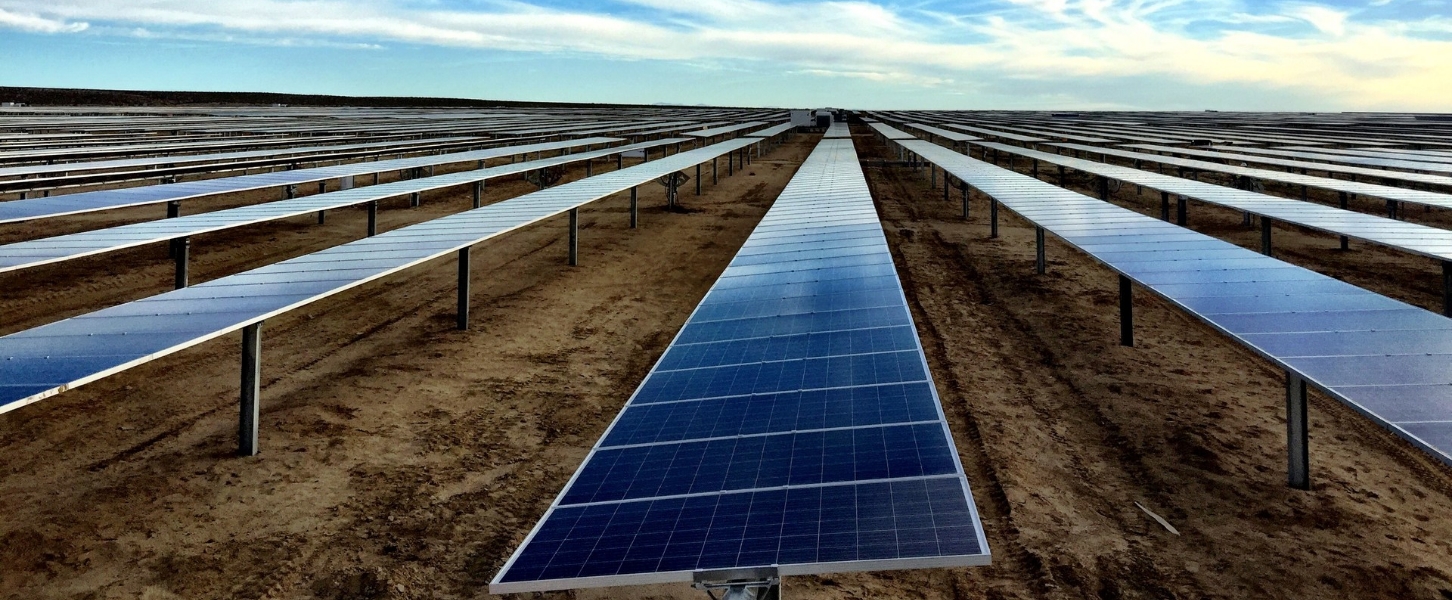
Vermont households use less energy than 80% of American states. Despite that efficiency, Vermont consumes more than three times as much energy as it produces.
State Fact Sheet
Download Fact Sheet
2,866
Bridges
4%
of Bridges are Deficient

69
High Hazard Dams

$5.0B
in Drinking Water Needs

1 Miles
of Levees
Protecting 3,331 people

13%
of Roads in poor or fair condition

$ 214.56
Motorist pays annually
due to insufficient infrastructure
5.1M
Passenger Trips on Public Transit
$5.1B
Wastewater needs

$3.5B
Total storm damage
(1980-2024)

IIJA Grants
IIJA Funding Announced
Number of IIJA Projects
Highgate Springs Port Expansion: This $150 million award will expand the existing port of entry in Highgate Springs on the Canadian border, improving capacity and efficiency for cross-border travel and trade.
Winooski River Bridge: This $24.8 million award will replace the Winooski River Bridge carrying US Routes 2 and 7 between Winooski and Burlington, improving safety and connectivity for travelers in Vermont.
Vermont Agency of Transportation: This $22 million award will purchase electric buses and charging equipment to replace aging diesel buses for Green Mountain Transit in Burlington, advancing Vermont’s transition to a zero-emission transit fleet by 2050.
Connect with Your Legislators
Let everyone know how important it is that we continue to invest in the future of America’s infrastructure.
Take Action Today