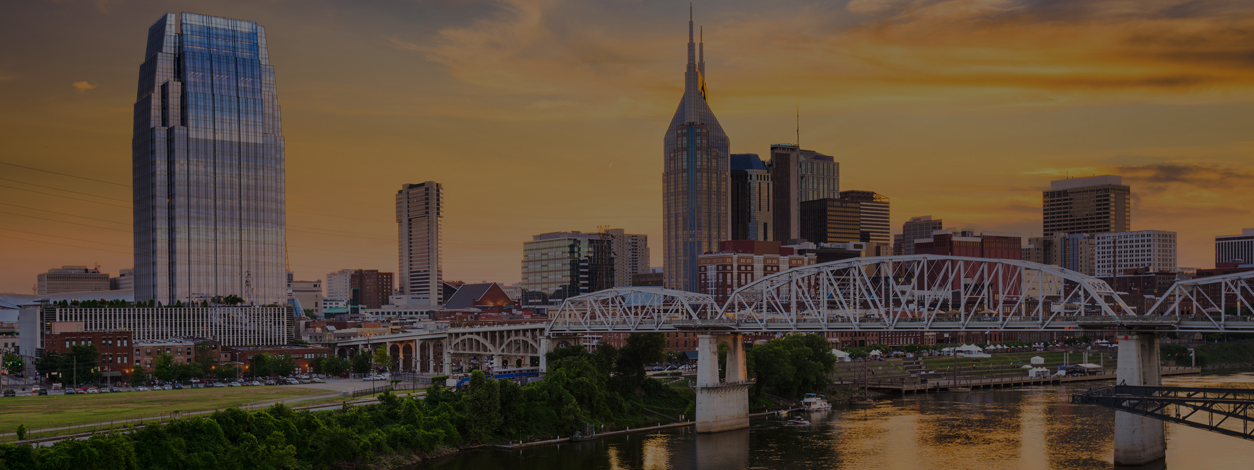


2022 Tennessee Infrastructure Report Card
2022 Report Card GPA: C
“Unprecedented” – a description that has been used almost to exhaustion in the past few years. It’s been used to describe COVID, severe weather events, workplace disruptions, and the list goes on. Unprecedented can also be used to describe where we find ourselves with regards to infrastructure. Tennessee, like the rest of the country, is seeing its roads, bridges, drinking water systems and more reach the end of their service lives. However, state action – along with more robust federal support – is coming at a crucial time and allowing us to rehabilitate much of our built environment. And not a moment too soon. We’ve seen what happens when we don’t invest, with closures of the I-40 bridge in Memphis, pipe breaks that prevent water from reaching homes and businesses, and power outages that last days or weeks following unexpected events including extreme weather, or domestic terrorism.
Fortunately, Tennessee has seen progress in some areas thanks in large part to increased funding from passage of state and federal legislation. Since 2016, the last time an Infrastructure Report Card was released for our state, multiple initiatives have been used to make strides in improving many areas of our state’s infrastructure. The increase of the state gas tax has allowed Tennessee to continue as a “Pay as you Go” state, one of only five in our country, while improving the overall condition of our roads and bridges and reducing or eliminating the local match required to fund some projects. Investment into the state’s parks systems included major renovations of lodges and camping areas at some of the state’s most popular destinations. Local utilities continue to provide safe and reliable drinking water with low interest rate loan programs. However, as our state’s population grows at ever increasing rates, use of transit systems is not increasing accordingly, and the additional stress on our solid waste and wastewater systems continues to mount.
Overall, there’s still work to be done. Much of our state’s infrastructure, similar to that across the country, is over 50 years old, and in some cases even older. As our infrastructure continues to age, we can’t afford to sit back and enjoy our progress – additional action is needed. Federal support is now on the way thanks to the 2021 Infrastructure Investment & Jobs Act (IIJA), and the American Rescue Plan (ARP), and opportunities abound for funding of infrastructure projects. While these support mechanisms look different for each area of infrastructure, the hope is that these laws allow significant gains to our state’s infrastructure in terms of condition, capacity, and resilience.
The opportunity for unprecedented improvement in our state’s infrastructure is apparent. However, along with being unprecedented, the hope is that it will also be long-lasting and impactful, ultimately improving the lives of the people of Tennessee, the users of the state’s infrastructure. As we look to the future of infrastructure in our state, let’s move from using the word unprecedented to using the word resilient.
Read the executive summary here.
-
Explore Tennessee
- Grades
- State Fact Sheet
- IIJA Grants
Tennessee Infrastructure Grades
A: Exceptional, B: Good, C: Mediocre, D: Poor, F: Failing
Each category was evaluated on the basis of capacity, condition, funding, future need, operation and maintenance, public safety, resilience, and innovation
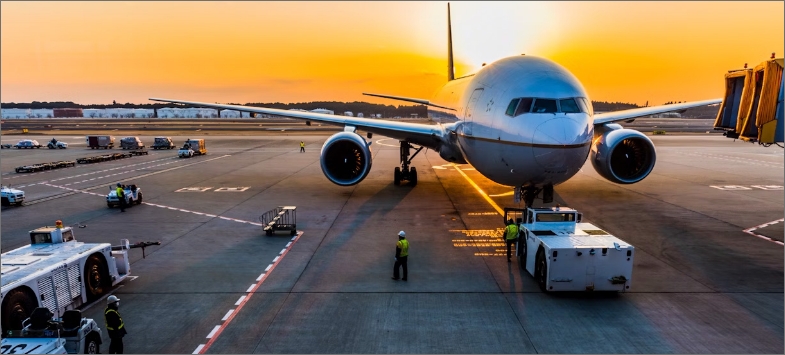

Aviation
There are 78 public-use airports in Tennessee: five primary commercial service airports and 72 general aviation airports. Memphis International Airport is a major freight hub and consistently ranks first nationally in the nation by tons landed. The aviation economy accounts for 221,000 jobs, $13 billion in payroll, and $40 billion in business revenue in 2019. Paved surfaces are in acceptable condition, with 68% rated as fair or better. Current and future aviation infrastructure in Tennessee is critically harmed by the state legislature’s vote in 2015 to cap aviation fuel taxes, causing an investment gap that widens as the legislation continues lowering the nominal cap amount each year – a sum losing value because of inflation.
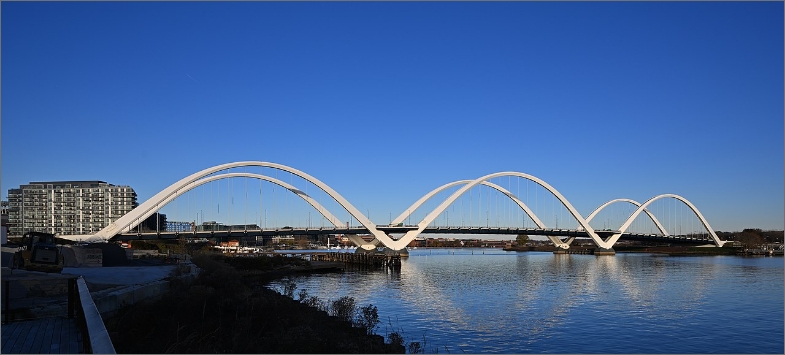
Bridges
With over 20,000 bridges within Tennessee, their impact on connectivity, commerce, safety, prosperity and a myriad of other aspects is far-reaching. 43% of bridges in the state are in good condition, 53% are in fair condition, and 4% of bridges are in poor condition. However, locally owned bridges are typically in worse condition than the statewide average. To help with local challenges, the Tennessee legislature decreased the required local match and provided funding in the 2017 IMPROVE Act for 536 local bridge replacement projects. The 2021 Bipartisan Infrastructure Law will provide a 56% increase in available transportation funding over the next five years, which can also help address the local bridge maintenance backlog.
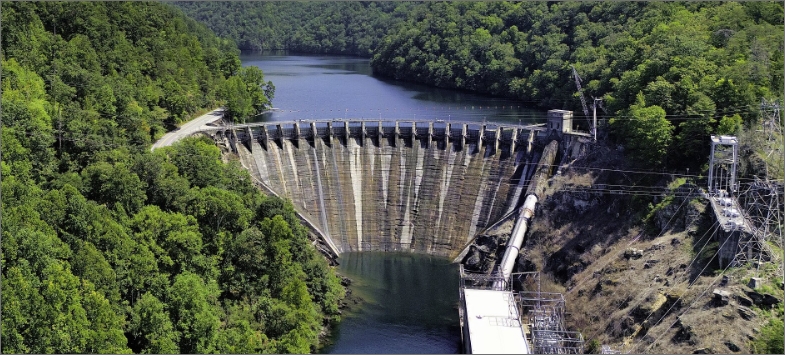
Dams
Tennessee is home to 1,238 dams for a variety of purposes: drinking water, flood control, recreation, and more. Most Tennessee’s dams – approximately 67% – are privately owned. Unless these privately-owned dams are large enough to be classified as “high-hazard,” potentially causing loss of life and property damage in failure, not much is known about their condition and maintenance practices. Of the 148 state-regulated high-hazard potential dams (HHP), 85% are in satisfactory condition. While all state regulated HHP dams have emergency action plans, just 46% of all HHP dams in the state can say the same. While some funding is allocated for dam repairs through federal funding from the 2021 Bipartisan Infrastructure Law, state-regulated dams still lack adequate budgets and staff to carry out critical dam inspections.

Drinking Water
The reliability of safe and plentiful drinking water is critical to Tennessee’s communities. EPA’s 6th Drinking Water Infrastructure Needs Survey and Assessment (2020) shows that $8.7 billion is needed to maintain and improve Tennessee’s drinking water infrastructure over the next 20 years. Tennessee’s share of the 2021 American Rescue Plan Act has started to flow through to utilities and more drinking water infrastructure projects are being implemented across the state. 43 utilities report struggling with treated water loss rates north of 40%, a costly occurrence. Overall, however, increases in investment and an exemplary public safety record suggests improving drinking water infrastructure conditions across the state.
Energy
In 1933, Congress established the Tennessee Valley Authority (TVA) to foster economic development, control flooding, and promote the integration of its natural resources. Almost 90 years later, TVA operates the nation’s largest public power system: generating and transmitting power to a population of nearly 10 million people and 700,000 businesses including Tennessee, Alabama, Mississippi, Kentucky, Georgia, North Carolina, and Virginia. TVA has operated with 99.9% reliability over the past twenty years while utilizing ASCE standards. Local power companies (LPC) take electricity from TVA and distribute to residents. Much greater public data from LPCs are necessary for decision-makers to understand Tennessee’s energy infrastructure needs.
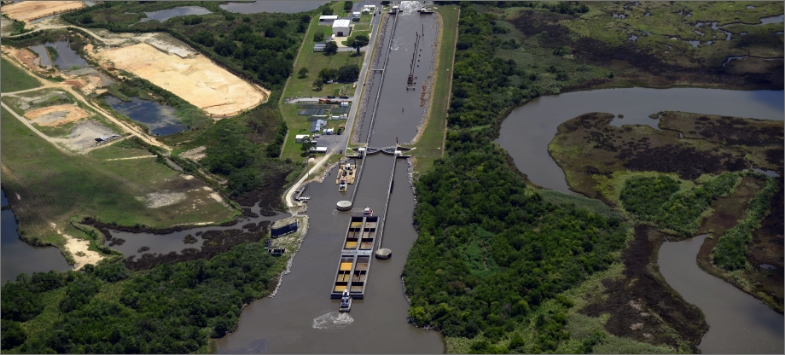
Inland Waterways
Tennessee’s locks and dams are located across 950 miles of inland waterways made up of the Cumberland, Mississippi, and Tennessee Rivers. Long-deferred capacity and condition improvements are finally taking place along the system. However, most efficiency enhancements have yet to be realized. At the Chickamauga Lock, 5-inches concrete expansion caused by chemical reaction is threatening the structure. A new lock, measuring 110 feet by 600 feet, is under construction, but the earliest completion date is 2024. At the Kentucky locks on the Tennessee River, tows frequently exceed 600 feet, requiring double locking that drives the average delays up to nine hours – the highest in the inland waterways system. A new project is underway to add a 1,200-foot navigation lock on the landward side of the existing locks. This will greatly increase the capacity of this section of waterways by allowing longer tows to pass through without double locking.
Public Parks
The overall condition of Tennessee State Parks facilities infrastructure is improving and safe. Parks funding has improved significantly – a surge of $28 million for maintenance from the FY2021 budget compared to an average annual spend of $5 million for those projects. Tennessee State Parks have been actively reducing the deferred maintenance backlog through state appropriations with about 35% of deferred maintenance needs being met over the last 3 budget cycles, and an estimated elimination of the deferred maintenance needs in three to four years. A permanent, dedicated funding source should be created to expand and improve park facilities without again collecting a list of necessary but unfunded projects.
Rail
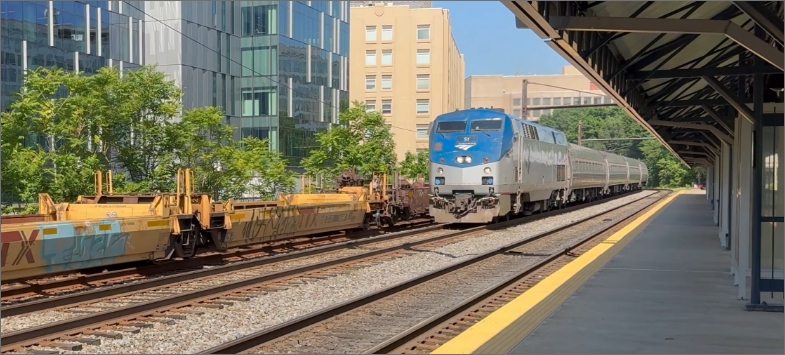
Tennessee has a total of 34 railroads, including 6 Class I rail lines with a total track mileage of 2,133 and 23 Class III rail lines with a total track mileage of 806. Memphis is the third largest freight rail center in the nation. Freight volumes transported on tracks in Tennessee are forecasted to grow 130% by 2040 when compared to 2012. The state added supplemental track mileage with new short-line and corridor capacity improvements, but this support is not sufficient when compared to the population increase and the demand growth in rail freight movement. One study showed varying infrastructure conditions on Class I and Class II track operations: an estimated 64% and 26% of tie conditions rated as sufficient, respectively, per U.S. Track Class Regulations. The same study determined 41% of mileage examined within the state must be upgraded to accommodate heavier rail cars. The main passenger rail in the state operates on a rail line owned by CN, where Amtrak riders will benefit from a $55 million redevelopment project at Memphis’ Central Station.
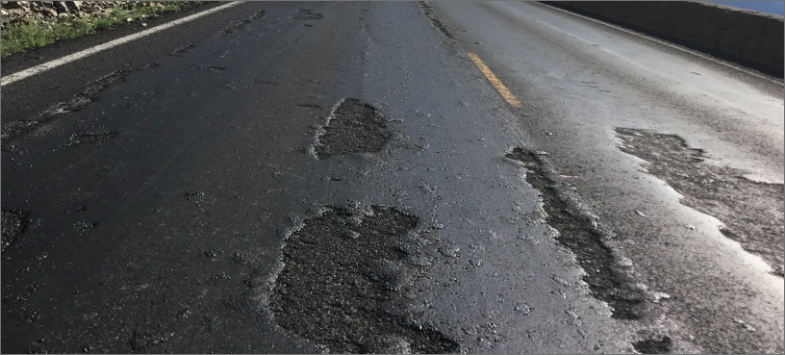
Roads
Tennessee has over 95,000 miles of highway that are critical for residents, visitors, and the movement of approximately $812 billion of goods shipped annually to and from the state. Tennessee’s population has grown by 9% since 2010. This steady growth has in turn increased the total vehicle miles travelled (VMT) by 7.4% since 2016. Increased vehicular traffic throughout the state has led to increased pavement deterioration, congestion, and traffic fatalities. In 2021, 50% of interstates and 44% of state routes were in good condition. However, deferred maintenance and funding shortfalls have resulted in declining pavement conditions over the past five years: the state’s average pavement Quality Index dropped from 4.2 in 2016 to 3.9 in 2021 for interstates; 3.6 to 3.3 between those years on state surface roads. Tennessee’s Traffic fatality rate in 2021 was 1.60 per 100 million vehicle miles travelled, compared to the national rate of 1.33. 1,325 residents died on Tennessee roads in 2020: an unacceptable number most effectively reduced by safer design and engineering of roads.
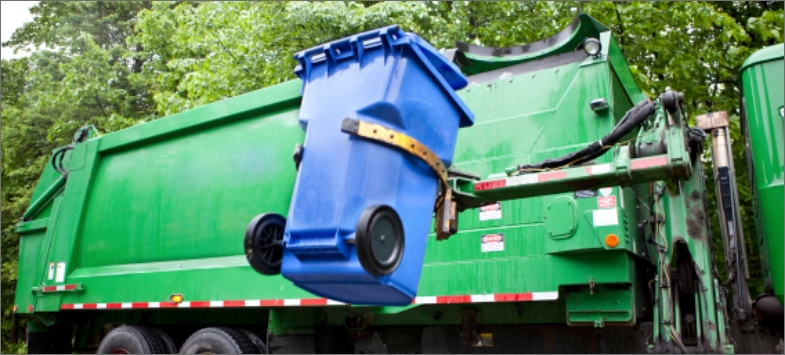
Solid Waste
Statewide, approximately 60 percent of municipal solid waste (MSW) is disposed in municipal sanitary landfills. With a fast-growing population, decision-makers in Tennessee must balance the regional benefits of waste disposal with localized harms: legal action has stopped expansion of landfills citing harms to adjacent communities, but long-distance waste removal is more expensive and generates regional climate harms. In 2019, Nashville was diverting only 18% of its solid waste away from landfills. Even if waste diversion increases, challenges attracting workers harm solid waste systems. In the City of Chattanooga, starting wages for waste drivers were increased by more than 40 percent, from just over $31,500 to $45,000. That allowed the city to restore recycling collection in November 2021 after halting in July. What is the resource they are using for TN. This looks like 50 % nationally based on the EPA report
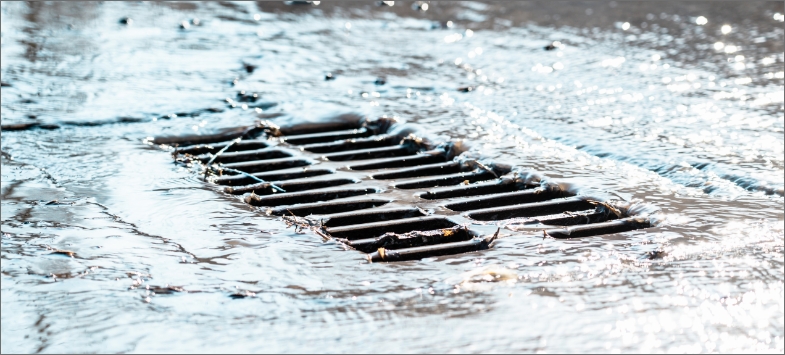
Stormwater
22 Tennessee municipalities have implemented stormwater utility fees over the last two decades. These fees form a funding backbone to maintain stormwater pipes and drains, manage flooding and erosion issues, and increasingly create or support green infrastructure. However, water quality in the state remains an issue, as seen by prevalence of contaminants. Of the 46% of waterways that have been assessed, 56% of rivers and streams are impaired with at least one pollutant and 38% of the state’s reservoir acreage is listed as impaired. Tennessee’s population is growing, increasing the amount of impervious surface area (e.g., roads, parking lots) which catch and convey stormwater runoff after adding harmful chemicals. New rules, finalized in May 2022, will help regulate new development sites and encourage the utilization of green infrastructure, including bioswales and rain gardens.

Transit
Tennessee features transit service in every county, including bus services on fixed-routes, express buses, dial-a-ride transit vehicles, local shuttles, and paratransit service for patrons with qualifying disabilities. Transit ridership statewide was only up to 60% of pre-pandemic levels in April 2022, but Tennessee’s Department of Transportation found pronounced need for service during weeknights and weekends, when Tennesseans depending on transit are more likely to make essential trips. Residents with mobility options are choosing transit less and clogging roads with private vehicles. For those “choice riders” to return to transit, dedicated funding streams like regional sales taxes are necessary for significantly enhanced service in Tennessee’s four large urban areas – including rail transit and bus rapid transit using dedicated lanes on the state’s most congested corridors.
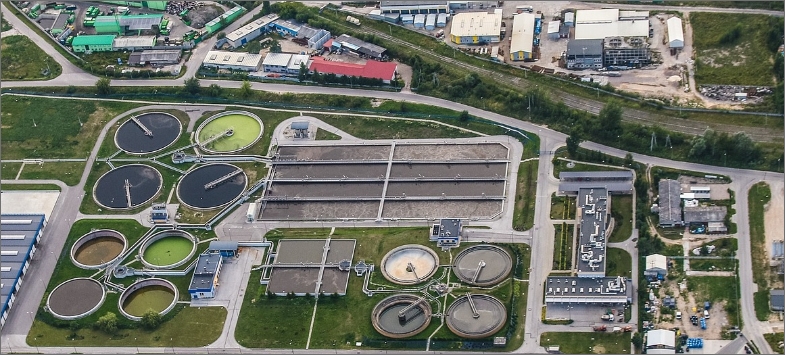
Wastewater
Over the past 10 years, Tennessee’s wastewater infrastructure successfully supported a 9% population increase and substantial economic growth. However, capacity enhancements were accomplished at the expense of maintenance, as evidenced by combined sewer overflows that result in sewer tap moratoriums. In 2019 there were 12 systems under a sewer tap moratorium due to overflows; in October 2022, there were moratoriums restricting new customers in some part of 45 municipalities. Overall, wastewater infrastructure owners report a $5.9 billion, 13-year funding gap for needed capacity and to bring the systems back to a state of good repair. A one-time infusion of $1.35 billion from the 2021 American Rescue Plan Act is going toward Tennessee’s water, wastewater, and stormwater projects. Additional support will be available from the Bipartisan Infrastructure Law passed last year. This will help supplement user fees, which average $26 per month and are a necessary component of safe systems collecting, cleaning, and delivering plentiful water to a growing state.

$8.7 billion is needed to maintain and improve Tennessee’s drinking water infrastructure over the next 20 years.
State Fact Sheet
Download Fact Sheet
20,374
Bridges
4%
of Bridges are Deficient

277
High Hazard Dams

$29.6B
in Drinking Water Needs

407 Miles
of Levees
Protecting 229,000 people

16%
of Roads in poor or fair condition

$ 291.36
Motorist pays annually
due to insufficient infrastructure
22.8M
Passenger Trips on Public Transit
$20.0B
Wastewater needs

$42.5B
Total storm damage
(1980-2024)

IIJA Grants
IIJA Funding Announced
Number of IIJA Projects
America's River Crossing Project: This $394 million award will replace the 75-year-old I-55 bridge over the Mississippi River, adding capacity and improving design to strengthen this nationally significant corridor for commerce and ensure safe, efficient connections for residents, workers, and freight between Tennessee, Arkansas, and Mississippi.
Memphis Area Transit Authority Facility: This $54 million award will build a new operations and maintenance facility capable of accommodating more than 300 vehicles, improving transit service efficiency and reliability.
Tennessee Transportation Capital Improvements: This $24 million award will rehabilitate or replace 42 bridges across 10 short line railroads in Tennessee, improving rail infrastructure and safety to support efficient freight movement.
Connect with Your Legislators
Let everyone know how important it is that we continue to invest in the future of America’s infrastructure.
Take Action Today