

2022 Virginia Infrastructure Report Card
2022 Report Card GPA: C
Virginia’s infrastructure forms the foundation for health, wealth, and safety for 8.6 million residents, more than 200,000 businesses, and over 100 million annual visitors. The Commonwealth moves people and goods along the critical I-95 corridor. It boasts expanding rail service connecting 127 million pounds of freight and 1.5 million passengers annually between the Northeast Corridor and mid-American transportation nodes. The Port of Virginia shuttles increasing volumes of goods on tracks, rather than trucks, with improved dockside infrastructure. Water systems for collecting rainfall and reducing floods are improving faster than national benchmarks.
Yet, infrastructure in the Commonwealth struggles from challenges like other growing states. Northern Virginia’s job creation and workforce cluster provide economic growth and increased tax revenue, but also increase the complexity of operations and maintenance, and demands on transportation systems. Virginia’s roads are increasingly clogged with drivers who lack feasible transit connections and comfortable bike routes for essential trips. The Tidewater region is growing fast as well, but the proximity of inland water, increasingly severe weather, and agricultural or industrial land uses pose contamination risks. Communities in rural Southwestern Virginia struggle to expand and upgrade infrastructure systems. Across the Commonwealth, inflation, workforce struggles, and political gridlock threaten infrastructure stewardship.
Virginia, however, has a lot to celebrate on infrastructure. The Commonwealth is sticking to its ambitious plans for passenger rail expansion drawn up before COVID-19 and they can be further enhanced using historically large funding from 2021’s Bipartisan Infrastructure Law. Transit systems in urban, suburban, and rural areas of Virginia lost customers due to the pandemic – and rail transit struggles to pull ridership back up to normal. But bus systems like the Virginia Breeze have already attracted riders more numerous than before COVID. AMTRAK passenger rail routes in the state are breaking records. An innovative treatment facility in Hampfton Roads treats wastewater to drinking water quality standards for injection into the aquifer to control saltwater intrusion and land subsidence – a national model. Traffic deaths in the Commonwealth have steadily increased since 2018, but decision-makers at the Commonwealth Transportation Board are putting safety high on the priority list with their cornerstone budget and planning documents.
Read the executive summary here.
-
Explore Virginia
- Grades
- State Fact Sheet
- IIJA Grants
Virginia Infrastructure Grades
A: Exceptional, B: Good, C: Mediocre, D: Poor, F: Failing
Each category was evaluated on the basis of capacity, condition, funding, future need, operation and maintenance, public safety, resilience, and innovation

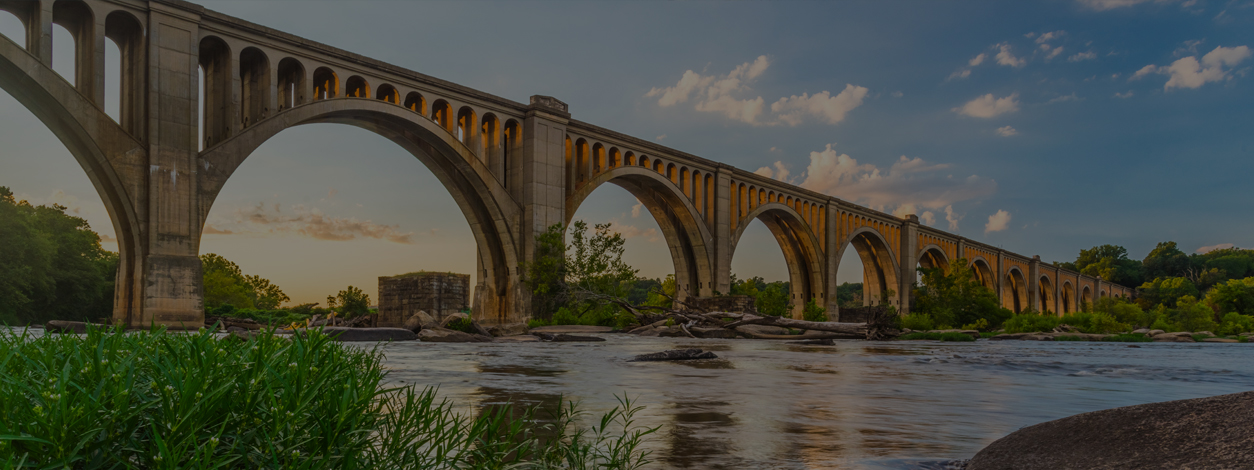
Bridges
Of the 21,250 bridges in the Commonwealth, 698 – or about 3% – are considered structurally deficient (SD, or “poor”), much better than the national average of 7.5%. This also marks a dramatic improvement from 2015, in which 1,550 SD bridges – about 7.5% – were structurally deficient. In 2015, the Virginia Legislature enacted a series of reforms and increased available revenue for its surface transportation program. It also enacted the State of Good Repair (SGR) program that mandates 30% of construction funding be provided for deteriorated pavements and structurally deficient bridges maintained and owned by VDOT and localities. The condition of Virginia’s bridges improved significantly since those reforms and thanks to the additional revenue. Looking forward, Virginia should emphasize preservation projects that keep aging bridges from continuing to fall into a state of disrepair.
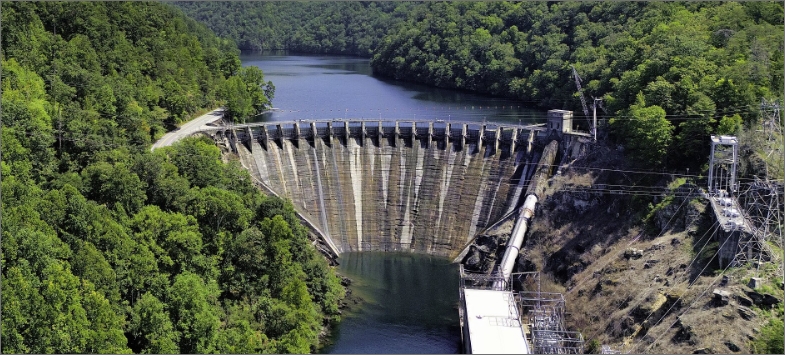
Dams
There are 2,634 state-regulated dams in the Commonwealth of Virginia. They’re pillars of water supply, flood control, irrigation, and recreation. Inspection of and emergency planning for these structures – particularly the 359 high hazard potential dams – is crucial. Over 50% of all state regulated high hazard dams have been inspected annually since 2017, a significant improvement from 2008 to 2012, when just 25% of high hazard potential dams were inspected each year. Ninety seven percent of the high hazard inventory have Emergency Action Plans, higher than the national average of 81%. Additionally, funding for state dam safety inspections has increased over the past decade. However, the average age of Virginia’s dams as of 2020 is 74 years old, significantly older than the national average of 57 years. Data for most Virginia dams is unavailable, meaning the problem could be much worse than known. Meanwhile, there are 1,842 dams in the state that report an undetermined hazard classification.

Drinking Water
Over the last six years, annual funding increases from $28 million to $33 million from the federal Drinking Water fund helped the Virginia’s drinking water infrastructure owners improved physical conditions. In addition, the General Assembly allocated $100 million from the federal COVID-19 American Rescue Plan to improve drinking water infrastructure in the Commonwealth. State funds are available for lead service line replacement, and since 2017, the City of Richmond, Washington County, Henry County, and the City of Chesapeake have received funding for these projects. The City of Alexandria has reduced lead pipes by 25% over the last four years. As populations grow, particularly in Northern Virginia and along the coast, municipalities are building new treatment plants and up-grading distribution networks. However, legacy systems are aging, and there are anecdotal reports of some pipes being over 100 years old. These systems require robust maintenance and regular funding for modernizations.

Public Parks
Almost all of Virginia’s 95 counties and 38 cities contain park facilities, and visitors to these parks generate significant economic benefits to the Commonwealth’s economy. According to the Virginia Department of Conservation and Recreation (DCR), Virginia state parks saw 7.9 million visitors in 2021, a 15% increase over 2019 and a 1.5% increase over 2020. Despite growing numbers of visitors, park maintenance at facilities is underfunded. Deferred maintenance at Virginia state parks is estimated at $111 million annually. DCR and localities are also challenged to hire sufficient staff to operate equipment and manage resources.
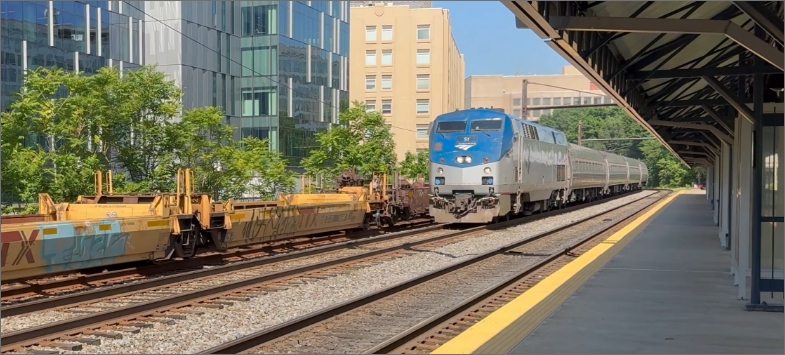
Rail
Virginia’s rail system consists of 3,037 miles of active lines served by two Class I and nine Class III freight railroads, up to 26 national and regional Amtrak passenger routes, and Virginia Railway Express intercity rail. Annually, over 127 million tons of freight and nearly 1.5 million passengers travel through Virginia. Inadequate capacity in the Richmond to Northern Virginia corridor is a constraint to Commonwealth rail infrastructure. This includes the dangerously old two-track Long Bridge; it operates at 98% capacity during peak times on weekdays. Public-private partnerships, such as the Transforming Rail in Virginia program, can increase and expand passenger service while improving freight performance on tracks they share. Meanwhile, the Port of Virginia is expanding rail capacity, and new federal and state funding is available to enhance the condition of passenger rail infrastructure and improve service.
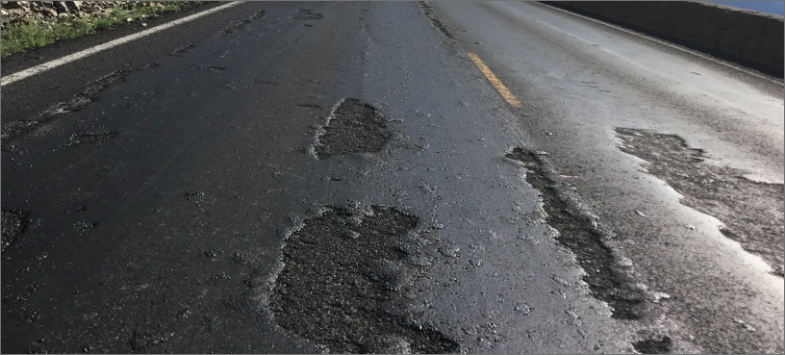
Roads
The Virginia Department of Transportation (VDOT) is responsible for the third‐largest state‐maintained highway system in the country. VDOT is a national leader in transportation asset management and has fully integrated the practice into its budgeting process and investment strategies. This has garnered positive results; the percentage of pavement condition that was in good condition rose from 48% to 51% from 2018 to 2022. 968 road users were killed in crashes on Virginia roads in 2021, a 21% jump from 796 in 2020 – despite only 8% more miles driven – and nearing Virginia’s previous peak of 1,026 in 2007. Roadway engineering to prioritize safety over speed is the most effective countermeasure. A 2020 Omnibus Transportation Bill mandates new funding for safety projects, including hundreds within the $672 million Commonwealth Transportation Board investment plan for FY2023-2028.
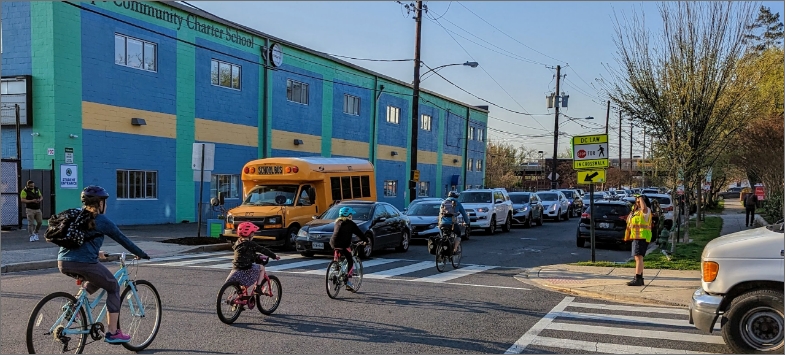
Schools
Beginning the 2021-2022 school year there were a total of 2,381 public schools operating in the Commonwealth of Virginia serving over 1.25 million students. Many of those students spend their days in older, outdated buildings that need replacement. The most recent assessment of schools, performed in 2021, determined that 52% of Virginia’s public school buildings are over 50 years old and estimated renovation costs exceed $24 billion. Virginia is currently faced with aging school infrastructure, shortfalls in funding for repairs/maintenance and operation of existing school facilities, a shrinking tax base in rural areas, and overcrowding in metropolitan areas. The Covid-19 pandemic has exacerbated the situation, making it more difficult for school systems across Virginia to properly maintain, repair, or upgrade school infrastructure.
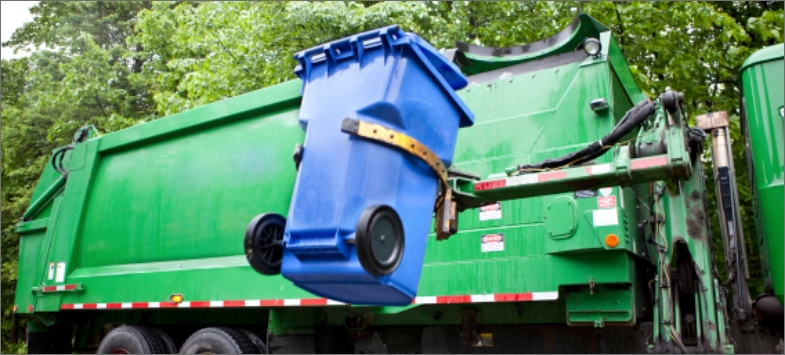
Solid Waste
There are 202 permitted waste facilities in Virginia that manage municipal solid waste and several other waste streams. Existing capacity is generally sufficient and due to open real estate for landfill operations, Virginia can maintain competitive disposal fees. Per capita solid waste generation rates in Virginia exceeded the national average by some 44 percent which was an increase of 11% from the amount reported in the 2015 Report Card. However, Virginians recycling rates are very high; in 2018, communities with populations over 100,000 achieved a recycling rate of 46%, approximately 11% higher than the national average of 34.7%. The grade stayed at B- after seven years. This reflects the balance between concerns for an 11% increase in per capita waste generation rate with the continued improvement in the per capita recycling rate which exceeded the national average by nearly 11 percent.
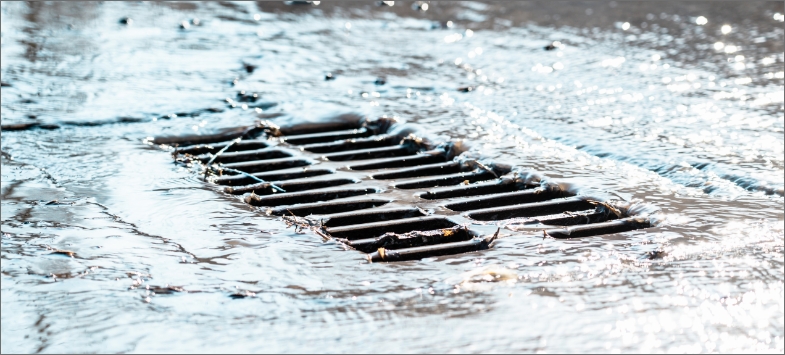
Stormwater
Increased development, aging infrastructure, more intense rainstorm events, and rising sea levels are all placing demands on the Commonwealth’s infrastructure systems susceptible to flooding. Fortunately, there is some limited funding available for capacity and condition improvements such as bioswales with native plants. Richmond, Portsmouth, Norfolk, Virginia Beach, Hampton, Chesapeake, Newport News, Lynchburg, Roanoke and Alexandria have stormwater user fees paid by residents. These fees serve as dedicated funding source for existing stormwater management services and new capital projects. In FY 2021, Virginia financed approximately $205 million in project loans targeted at 14 projects through the Virginia Clean Water Revolving Loan Fund, however, future needs are significant. More than 70% of the commonwealth’s population lives in coastal areas. Meanwhile, it is estimated that 1 inch of water in a home can cause upwards of $25,000 in damages.
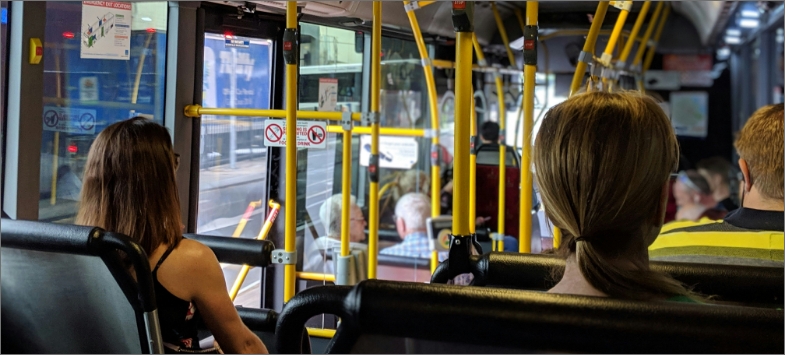
Transit
The Commonwealth’s 41 transit agencies provided almost 172 million trips in FY 2019, the last year before the COVID-19 pandemic. That year, the Commonwealth’s 16 commuter assistance programs removed almost 3.3 million automobile trips and 937 vanpools provided almost 2 million trips. Nineteen transit agencies reported ridership increases. Since the onset of the pandemic, transit agencies are fighting to win back riders with investments in capacity and condition. In FY21, the Commonwealth Transportation Board provided funding for 137 replacement revenue vehicles, 17 expansion vehicles, and the rehabilitation of 42 buses. The second phase of the Silver Line extension from Falls Church to Dulles Airport opened November 2022 adds high-quality transit options to growing communities in Northern Virginia. While this is encouraging, the 2022 Virginia Department of Rail and Public Transportation (VDRPT) needs assessment shows a 5-year, $208 million gap between projected available funds and what is needed to deliver transit services and modernize the existing system.
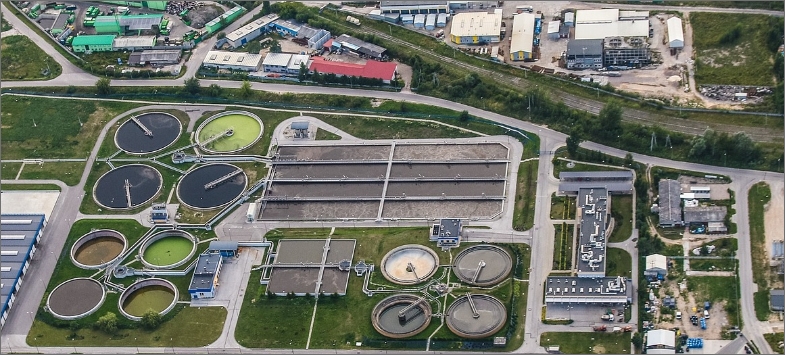
Wastewater
There are an estimated 584 municipal wastewater treatment facilities in Virginia serving a population of over 8.5 million. Virginia’s three cities with combined sewer systems – Richmond, Lynchburg, and Alexandria – have made considerable progress in reducing combined sewer overflows, but remaining remediation will cost an estimated $700 million to $900 million. A 2012 survey estimated Virginia’s wastewater infrastructure needs exceeded $6.4 billion, probably much higher today due to inflation, aging physical infrastructure, and worsened threats from climate change such as infiltration and inflow. Utilities are raising their rates to meet this challenge: $44.70 was the Commonwealth average in 2018, compared to $42 nationally. Virginia water systems continue to innovate, including SWIFT. SWIFT takes highly treated water normally discharged into local waterways and puts it through additional advanced water treatment to achieve drinking water quality SWIFT Water which is then used to replenish the Potomac Aquifer.
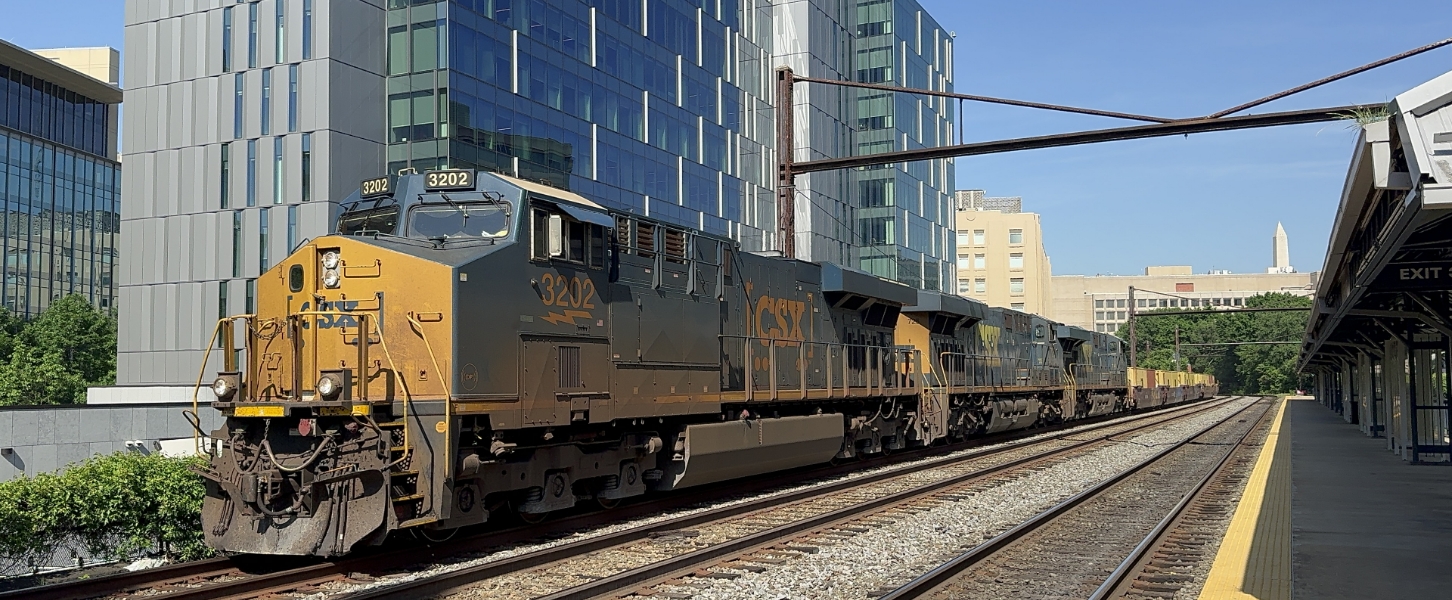
Annually, over 127 million tons of freight and nearly 1.5 million passengers travel through Virginia.
State Fact Sheet
Download Fact Sheet
14,143
Bridges
3%
of Bridges are Deficient

438
High Hazard Dams

$23.4B
in Drinking Water Needs

16 Miles
of Levees
Protecting 21,700 people

46%
of Roads in poor or fair condition

$ 714.85
Motorist pays annually
due to insufficient infrastructure
55.7M
Passenger Trips on Public Transit
$50.0B
Wastewater needs

$25.5B
Total storm damage
(1980-2024)

IIJA Grants
IIJA Funding Announced
Number of IIJA Projects
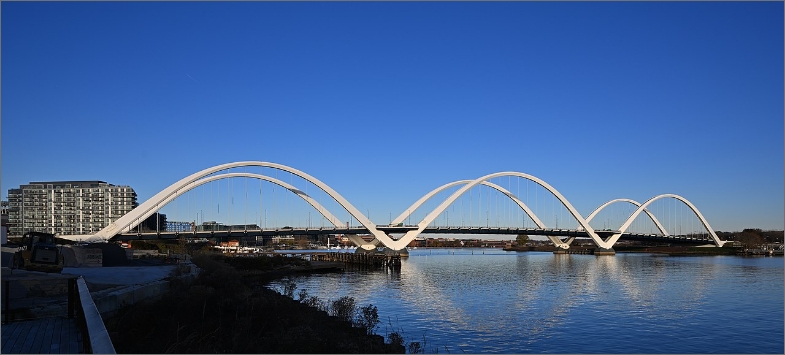
Multimodal Bridge over the Potomac River: This $20 million award will help create a 2,300-foot bicycle-pedestrian bridge connecting Long Bridge Park in Arlington, VA, to East and West Potomac Parks in Washington, DC, expanding safe, sustainable travel options across the river.
Transforming Rail in Virginia, Phase 2: This $729 million award will expand capacity, alleviate bottlenecks, and improve reliability along 12 miles of rail between Washington, DC, and Richmond, VA, including construction of the new Long Bridge over the Potomac River to enhance passenger and freight movement.
City of Norfolk Coastal Storm Risk Management: This $399 million award will build flood protection measures in Norfolk, including storm surge barriers, pump stations, floodwalls, levees, tide gates, property elevation, and natural features like oyster reefs and living shorelines, reducing coastal flooding risks and enhancing resilience.
Connect with Your Legislators
Let everyone know how important it is that we continue to invest in the future of America’s infrastructure.
Take Action Today